

 Platform Overview

 Integration Hub

 Agent One™

 Agent One™ Teams

 Customer Data Management

 Personalization

 Journey Orchestration

 Reporting & Data

 Behavioral Analytics

 Web
Web

 Email
Email

 Site Search

 Conversational CX

 WhatsApp

 Web Push

 InStory

 App
App

 SMS & RCS

 Join the $0 Migration Movement™

 The Insider One Difference

 Compare Vendors

 Switch to Insider One

 Success Story

 Retail & Ecommerce

 Financial Services

 Travel & Hospitality

 Beauty & Cosmetics

 Automotive

 Telecommunications

 Total Economic Impact™ Study

 Blog
Blog

 E-Books & Guides

 Events

 Glossary
How to Map Customer Journeys with First-Party Data

Updated on 9 Jul 2026
9 min.
Table of Contents
- Summary
- Why first-party data changes everything about journey mapping
- Building your first-party data foundation before you draw a single stage
- Defining journey stages using signal taxonomies, not assumptions
- From map to action: orchestrating triggers across channels
- Measuring whether your journey map is actually working
- Frequently asked questions
Most Popular
Summary
Effective customer journey mapping is built on unified first-party data rather than static personas. Real-time behavioral signals and lifecycle-based actions help move customers through their journey, while success is measured by progression and long-term customer value.
The journey map on your conference room wall was probably built during a two-day workshop, anchored to personas that felt real at the time, and last updated when someone remembered it existed. That’s not a failure of effort. It’s a failure of inputs.
Persona-based maps describe the customer you imagined, not the one who visited your site at 11pm, abandoned checkout, and opened your SMS 40 minutes later. The gap between those two versions is where revenue leaks.
Customer journey mapping has always been about understanding how customers move toward value. What’s changed is the data available to fuel that understanding. Cookie deprecation and tightening privacy regulations have made third-party-dependent maps structurally unreliable, not just directionally imprecise.
Teams that replace third-party signals with first-party behavioral data aren’t just compliant; they’re working with a more accurate picture of intent than they ever had before. The challenge is connecting that data to a live journey canvas that responds to it.
Why first-party data changes everything about journey mapping
The structural problem with static maps
A traditional journey map captures a hypothesis about how customers behave. It describes stages, touchpoints, and emotional states based on research that was accurate when it was gathered and increasingly approximate after that. When those maps are built on third-party audience data, the approximation degrades faster because the underlying data source is disappearing.
Browsers have restricted third-party cookies, and regulatory pressure on cross-site tracking continues to tighten. Maps built on that foundation don’t just age badly. They misroute decisions.
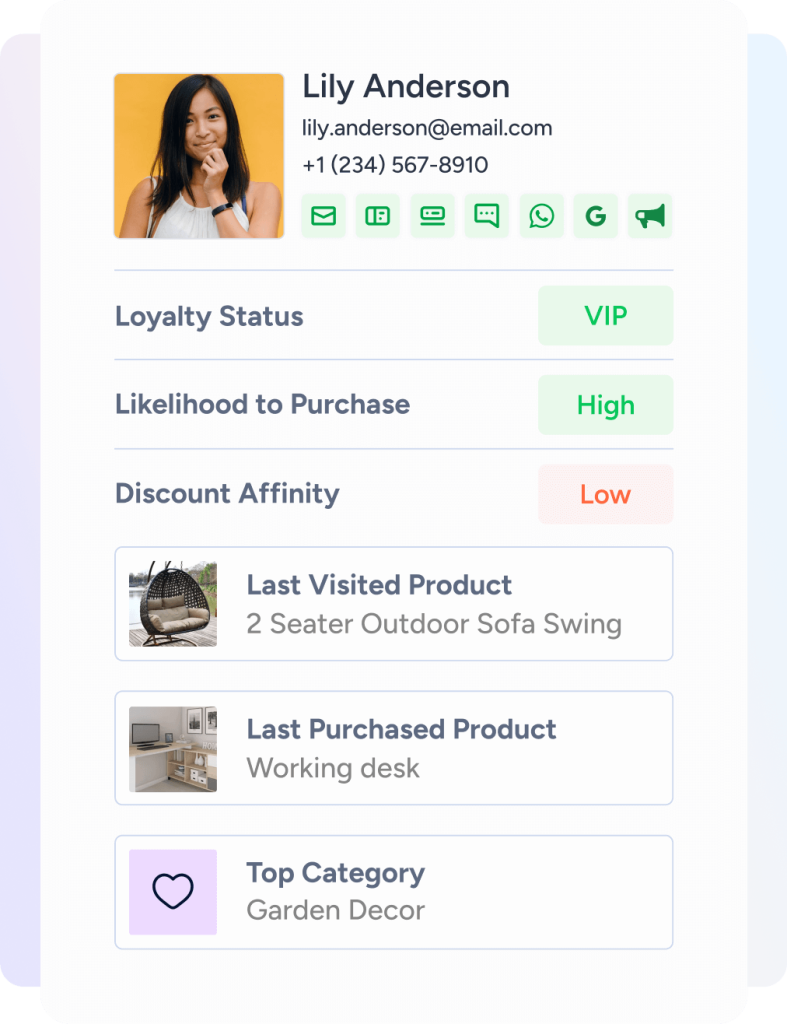
First-party data changes the dynamic because it’s owned, consented, and continuously updated. When a customer browses a category page, completes a purchase, opts into a loyalty program, or clicks a personalized email, each of those events is a signal that can update their profile in real time.
A journey map fed by those signals isn’t a diagram. It’s a living decision layer that reflects where each customer actually is, not where a persona model assumes they should be.
Dynamic maps versus static documents
The practical difference between a static map and a dynamic one isn’t philosophical. A static map tells your team what the average customer does in week three of the lifecycle.
A dynamic map routes the actual customer in front of you based on what they did in the last session, what they’ve purchased historically, and what they’ve explicitly told you about their preferences. One informs strategy. The other executes it.
Building your first-party data foundation before you draw a single stage
The three data layers that matter
Before any journey canvas is worth building, three data layers need to be collected and unified. The first is on-site behavioral events: page views, category engagement, search queries, product detail interactions, add-to-cart actions, and session depth. These signals reveal intent at a granular level and are the fastest-moving data in any customer profile.
The second layer is customer relationship management (CRM) and transactional records: purchase history, order frequency, average order value, return behavior, and support interactions. These signals define relationship maturity and economic value.
The third layer is zero-party declared preferences: stated category interests, communication channel choices, frequency preferences, and survey responses. These are the signals customers hand you directly, and they carry significant weight in personalization accuracy.
The most common collection gap teams encounter is treating these three layers as separate systems rather than a unified profile. Behavioral data sits in an analytics tool, transactional data lives in the CRM, and declared preferences are buried in an email preference center that nobody has connected to anything.
Journey mapping with fragmented data produces fragmented journeys. The Customer Data Management layer underneath your journey canvas determines the ceiling of everything built on top of it.
Identity resolution: stitching anonymous to known
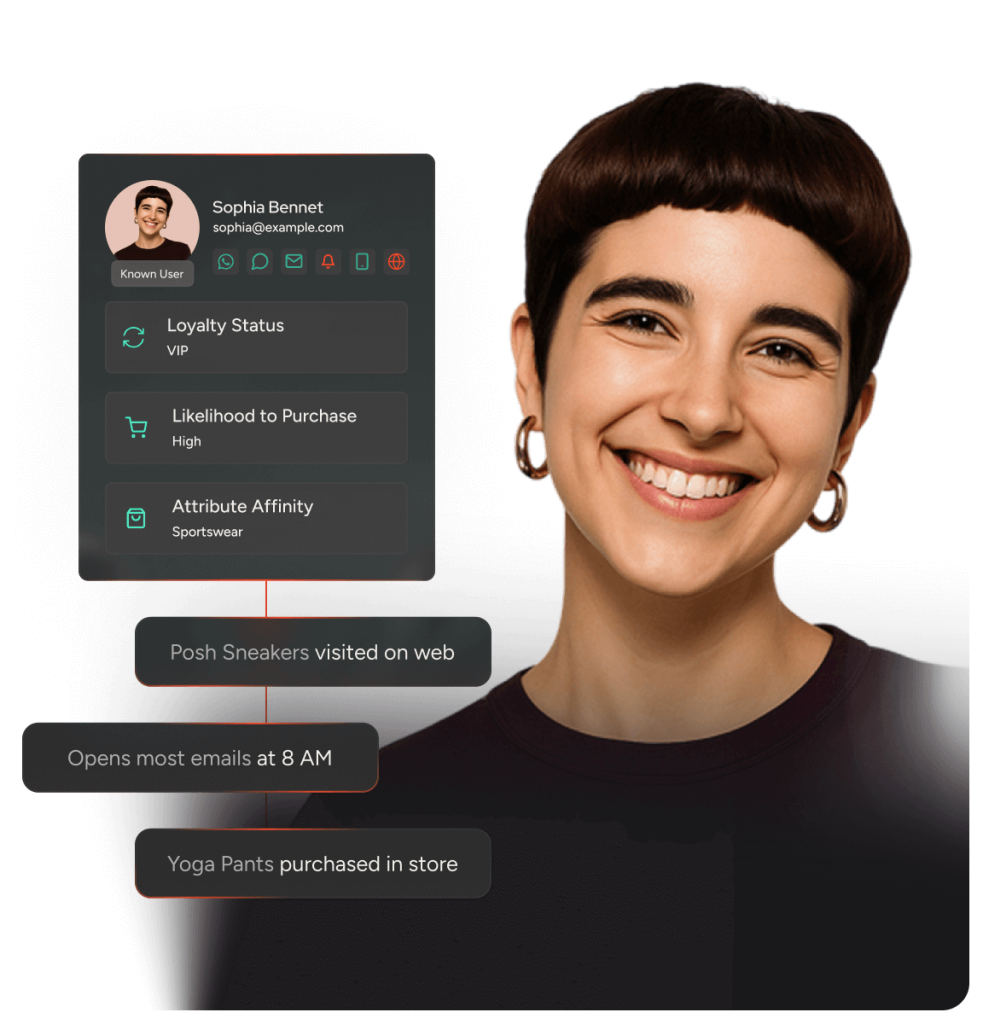
A significant portion of a brand’s behavioral data belongs to people who haven’t identified themselves yet. Anonymous sessions on a website carry real intent signals, but they’re useless for journey personalization until they’re connected to a known profile.
Identity resolution, the process of stitching anonymous sessions to known customer records, happens through a small number of events: email capture from a pop-up or checkout form, loyalty program login, or app authentication. Each of these events is a resolution moment that should trigger a profile merge in the customer data platform (CDP).
Getting this right matters more than most teams realize. A customer who browses extensively, abandons a cart as an anonymous session, and then identifies themselves at checkout has an intent history worth acting on. If the session data doesn’t merge into the known profile, the post-purchase journey starts blind.
That anonymous browse session contains the product affinity signals that should inform the first retention email, the next push notification, and the category recommendations in the following visit.
Defining journey stages using signal taxonomies, not assumptions
What a signal taxonomy is and why it matters
A signal taxonomy is a documented mapping of specific first-party events to lifecycle stage labels. Instead of assigning customers to “consideration” because they’re in a certain email segment or because 14 days have passed since acquisition, a signal taxonomy defines exactly which behavioral conditions constitute consideration.
For example: visited the product detail page three or more times, added to cart at least once, no purchase in the current session, within 30 days of first visit. Those conditions are observable, measurable, and automatically updatable.
Without a taxonomy, journey stages become organizational folklore. Different teams define “active” differently. Campaigns contradict each other because one team thinks a customer is in retention while another is running a win-back sequence on the same profile.
A documented signal taxonomy creates a shared vocabulary that connects marketing intent to data reality. It’s the foundational work that makes journey orchestration coherent rather than chaotic.
Using predictive scoring to assign stage probability in real time
Predictive models trained on first-party behavioral patterns can go further than rule-based taxonomies by assigning a journey stage probability score to each profile. Rather than a binary “this customer is in retention,” a model can express that a customer has a high probability of churn based on declining session frequency, reduced email engagement, and a shift in purchase cadence.
That probability score can trigger a preventive retention sequence before the customer fully disengages, rather than waiting for them to cross a static threshold.
This kind of real-time stage transition is where behavioral analytics becomes operationally valuable. The signals are already being collected. Translating them into stage probability scores and routing customers into the right journey branch is the activation step that separates teams who map journeys from teams who run them.
Insider One AI™ applies predictive intelligence to exactly this problem, scoring customer lifecycle position dynamically so journey branches respond to actual signal conditions rather than manual segment updates.

From map to action: orchestrating triggers across channels
Converting stage transitions into channel triggers
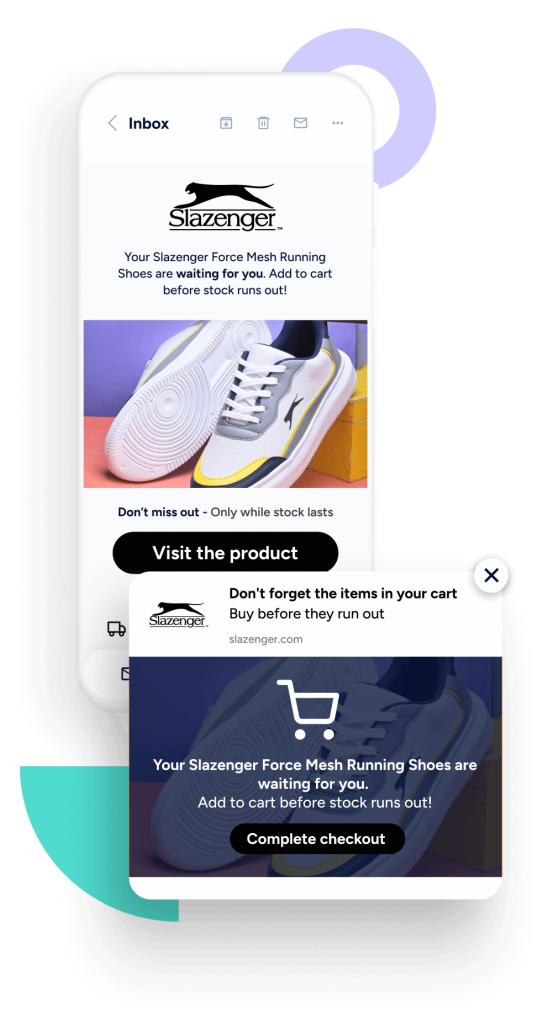
A journey stage transition is only useful if it triggers something. When a customer moves from consideration into high-intent based on their signal conditions, the canvas should branch immediately into the appropriate sequence: a personalized email featuring the product category they’ve been browsing, a push notification with a time-sensitive offer, or an on-site experience that surfaces social proof on the product detail page they keep returning to.
The trigger logic is tied to first-party signal conditions, not to calendar dates or time delays.
This is the design principle that distinguishes omnichannel customer journeys from multichannel campaign calendars. A campaign calendar sends the same email to everyone on Tuesday. A triggered journey sends the right message to the right person the moment their behavior warrants it, across whichever channel they’re most likely to respond on.
For teams using Architect, branching logic can wire stage transitions directly to channel-specific actions across email, push, SMS, WhatsApp, and on-site personalization from a single canvas.
MadeiraMadeira achieved 52X ROI using exactly this kind of coordinated orchestration through Architect, demonstrating what’s achievable when triggers are signal-driven rather than schedule-driven.
Frequency governance using engagement signals
Trigger-based journeys risk one failure mode that time-based calendars share: message fatigue. The difference is that first-party engagement signals give you the data to govern frequency intelligently.
Open rate history, session recency, opt-down behavior, and channel interaction patterns are all signals that should feed suppression logic into the journey canvas.
A customer who hasn’t opened an email in 60 days shouldn’t receive the same email cadence as one who opens every message. A customer who opted down from SMS frequency should be excluded from SMS branches even when their behavioral signals qualify them for a trigger.
Frequency governance isn’t about sending less. It’s about maintaining journey continuity without eroding the relationship.
The suppression logic sits inside the same canvas as the triggers, pulling from the same first-party profile data, so the journey is coherent even when it’s being selective about which channels fire for which customers.
Measuring whether your journey map is actually working
The metrics that map to journey effectiveness
Last-click attribution tells you which channel got credit for the conversion. It doesn’t tell you how the customer got there, which stage they were in before they converted, or whether the journey sequence accelerated that conversion or just captured it.
For journey-led marketing, the metrics that matter are stage progression rate, trigger response rate, channel attribution by stage, and lifetime value delta between customers who traveled the intended journey and those who didn’t.
Stage progression rate measures how efficiently customers move from one defined stage to the next. A low progression rate from consideration to activation is a signal that the triggers in that stage aren’t working, not that the customers aren’t convertible.
Lifetime value delta, comparing cohorts who experienced the full journey sequence against those who didn’t, is the clearest indicator of whether the journey architecture is creating economic value or just adding process overhead.
Slazenger achieved 49X ROI in eight weeks with omnichannel journey orchestration, a result that’s only legible when measured against lifecycle value rather than single-campaign attribution.
Building the feedback loop
A/B testing journey variants against a holdout group is the mechanism that turns a journey map from a static deployment into a continuously improving system. The holdout group receives no orchestrated journey interaction.
The test group runs through the defined stage triggers and channel sequences.
First-party conversion data, purchase events, engagement depth, and churn signals are the outcome metrics. The delta between groups, measured over a meaningful time horizon, tells you whether the journey is accelerating outcomes or whether customers were going to convert anyway.
The feedback loop that emerges from this testing discipline does three things: it refines stage definitions by revealing which signal conditions actually predict progression, it improves trigger timing by showing which response windows produce the best engagement, and it sharpens content relevance by connecting message variants to conversion outcomes.
Teams using Insider One’s reporting and analytics layer can run this kind of journey-level analysis directly against the same profiles that power the triggers, so the insight and the activation stay connected rather than living in separate systems.
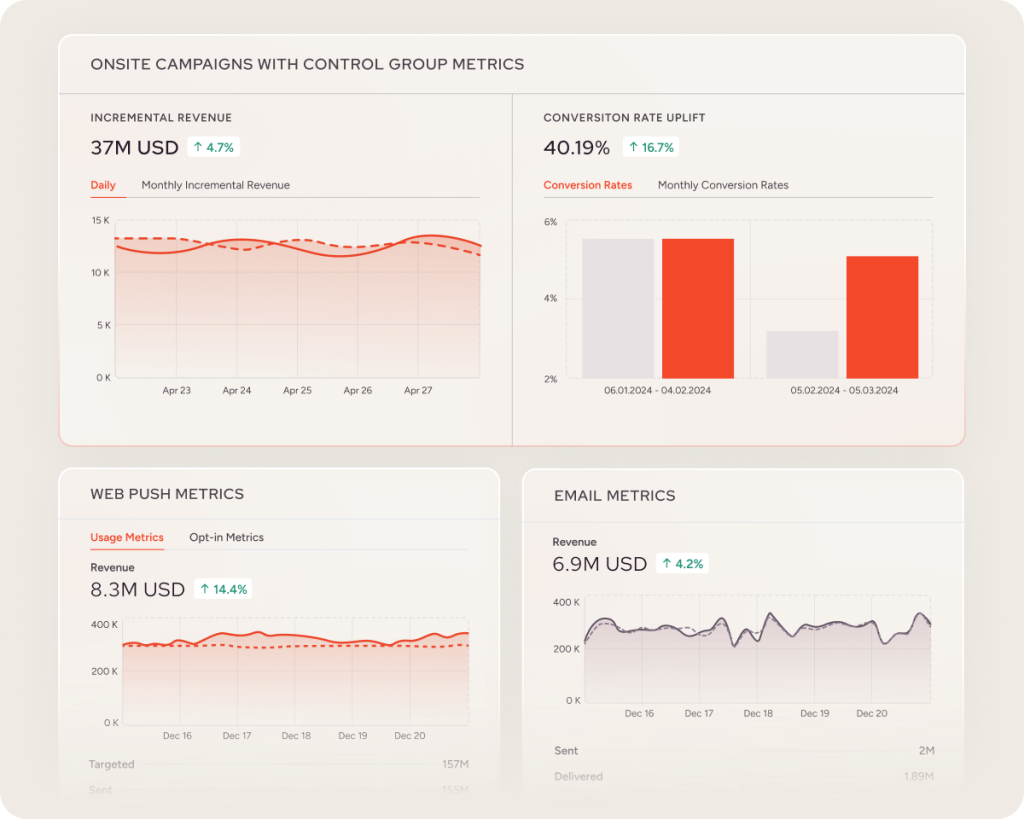
If you want to see how Insider One’s Architect, Customer Data Management, and Insider One AI turn live customer data into coordinated, revenue-driving experiences, book a personalized demo to see the exact use cases, decision logic, and growth levers most relevant to your team.
Frequently asked questions
You don’t need a fully deployed enterprise CDP on day one, but you do need a unified profile layer that can ingest behavioral events, transactional records, and declared preferences and expose them to a journey canvas in real time.
A CDP makes that architecture significantly more reliable and scalable. Starting without one creates the identity resolution gaps described above, which limit how accurately the journey can reflect real customer behavior.
Start with the five to seven lifecycle stages most relevant to your business model and define three to five observable signal conditions for each stage. Granularity can increase as the system matures.
The risk of over-engineering a taxonomy before deployment is that it becomes a documentation project rather than an operational one. Define enough to build from, then let the feedback loop sharpen the definitions.
Backward stage transitions are as important as forward ones. A customer whose session frequency drops sharply and whose email engagement declines over 30 days should trigger a re-engagement or win-back branch automatically, regardless of their previous stage.
The signal taxonomy should define regression conditions as explicitly as progression conditions, and the journey canvas should have branches that route customers into those recovery sequences without requiring manual intervention.

Keep Reading
4 min.

Chris Baldwin
3 Feb 2026
9 min.
Chris Baldwin
22 Oct 2026
8 mins.
Chris Baldwin
8 Oct 2026