

 Platform Overview

 Integration Hub

 Agent One™

 Agent One™ Teams

 Customer Data Management

 Personalization

 Journey Orchestration

 Reporting & Data

 Behavioral Analytics

 Web
Web

 Email
Email

 Site Search

 Conversational CX

 WhatsApp

 Web Push

 InStory

 App
App

 SMS & RCS

 Join the $0 Migration Movement™

 The Insider One Difference

 Compare Vendors

 Switch to Insider One

 Success Story

 Retail & Ecommerce

 Financial Services

 Travel & Hospitality

 Beauty & Cosmetics

 Automotive

 Telecommunications

 Total Economic Impact™ Study

 Blog
Blog

 E-Books & Guides

 Events

 Glossary
Mobile App Engagement Metrics That Drive Better Decisions

Updated on 24 Sep 2026
15 min.
Table of Contents
- Summary
- Why app teams often measure the wrong things
- The core engagement metrics every mobile team must track
- Deeper signals: feature adoption, screen flow, and push opt-in rate
- Real-world examples: What happens when brands act on these metrics
- Turning metrics into a repeatable engagement system
- Frequently asked questions
Most Popular
Summary
Mobile app engagement is driven by meaningful user behaviors, not installs or vanity metrics. Tracking high-intent signals, acting on them in real time, and measuring retention across the user lifecycle helps reduce churn and increase long-term customer value.
Somewhere between a record-breaking launch quarter and a quietly failing product, there is usually a dashboard full of impressive numbers. Downloads are climbing. Store ratings look fine.
But daily active users are flat, session length is shrinking, and a cohort of first-week installs has already gone dark. The gap between acquisition success and engagement reality is one of the most expensive blind spots in mobile product management.
The problem is rarely a lack of data. It is a lack of structure around which numbers matter in what sequence.
Mobile app engagement metrics only become actionable when you understand whether you are looking at a leading signal, something that predicts what is about to happen, or a lagging indicator, something that confirms what already went wrong.
Getting that distinction right determines whether your mobile marketing team responds to churn before it compounds or after it shows up in your retention curve.
Why app teams often measure the wrong things
Noise versus signal: Grading metrics by intent
Install counts feel like progress, but they measure marketing reach, not product value. An app with 500,000 downloads and a 10% Day-30 retention rate is a very different business than one with 150,000 downloads and a 35% Day-30 retention rate.
The first is filling a leaky bucket; the second is building an audience.
But the sharpest way to read these numbers is not vanity versus engagement at all. It is noise versus signal: how much intent a behavior actually carries. A metric’s worth is not whether it leads or lags, it is how loudly the action predicts value and how close it sits to the moment a user commits.
Strong signals are high-intent actions that sit one step from value: core-feature adoption, a connected bank account, an add-to-cart, growing repeat-session depth, or a push opt-in accepted right after a value moment.
Low signals are ambient activity that could mean almost anything: installs, session counts, store page views, and total registered users.
Installs are simply the loudest low-intent signal, high in volume and near-zero in intent, which is exactly why a leaky-bucket app can post record downloads while the business quietly erodes.
The practical rule follows directly: log low signals for reporting, but build your triggers on strong ones. Bank-connect for a fintech app or add-to-cart for an e-commerce app are among the strongest positive signals you can track, because each sits a single step from revenue.
A widening session interval is an equally strong negative signal. Both deserve a real-time response, not a line in a monthly report.
Vanity metrics, including installs, store page views, and total registered users, have their place in acquisition reporting, but they can actively mislead product and growth teams when used as proxies for engagement health.
A spike in installs driven by a paid campaign can mask the fact that a large share of those users never complete onboarding. The metric looks positive while the business problem compounds invisibly underneath it.
The leading versus lagging indicator framework
The more useful framing is to split your key customer engagement metrics into two categories: leading indicators that predict what users are about to do, and lagging indicators that confirm what already happened.
Session frequency, feature adoption rate, and push notification opt-in rate are leading indicators. They signal whether a user is building a habit with your app or quietly drifting toward uninstall.

LTV, churn rate, and revenue per user are lagging indicators. By the time these move in the wrong direction, you have already lost the users who drove the shift. Acting on leading indicators gives you a window to intervene; acting on lagging indicators means you are writing a post-mortem.
Timing and intent are two different lenses, and the best metrics score well on both. Leading versus lagging tells you when a signal fires; strong versus low tells you how much it is worth acting on.
The behaviors that sit at the intersection, core-feature adoption or an opt-in captured after a value moment, are leading and high-intent at once, and that intersection is exactly where behavioral triggers belong.
The core engagement metrics every mobile team must track
DAU, MAU, and the stickiness ratio
Daily active users (DAU) and monthly active users (MAU) are foundational, but neither number is particularly useful on its own.
The ratio between them, DAU divided by MAU, gives you what is commonly called the app stickiness metric: the share of your monthly audience that returns on any given day.
Category context matters here. Social and entertainment apps typically target a higher DAU/MAU ratio because daily habitual use is the product. Utility and productivity apps operate at a lower ratio, and that is entirely healthy, because users open them when they need them rather than out of habit.
As rough industry reference points, a DAU/MAU ratio above 20% is generally considered healthy, 20% to 30% is strong, and anything sustained above 50% is exceptional and typically limited to social, messaging, and entertainment apps.
Utility, productivity, and fintech apps often run a perfectly healthy 10% to 20%. Retention benchmarks follow the same category logic: across mobile apps broadly, average Day-1 retention tends to land in the low-to-mid 20% range, and average Day-30 retention often falls to the mid-single digits, so a 35% Day-30 rate is genuinely top-tier while a 10% rate signals a leaky bucket.
Treat these as orientation rather than targets; your own historical cohorts are always the more reliable benchmark.
Healthy DAU/MAU benchmarks by app category
| App category | Healthy DAU/MAU ratio | What good looks like |
| Social, messaging & entertainment | 20% to 50%+ | Daily habitual use is the product itself |
| Utility & productivity | 10% to 20% | Need-based use; a lower ratio is perfectly healthy |
| Fintech & ecommerce | 10% to 20% | Judge on task completion and repeat purchase, not raw frequency |
Setting a benchmark without knowing your category creates false alarms. A fintech budgeting app with a relatively low stickiness ratio is not necessarily struggling; it may be performing well for its use case.
Session length, frequency, and interval
Session length measures how long users stay engaged per visit. Session frequency measures how often they return in a given period. Session interval measures the gap between visits.
Together, these three metrics describe the texture of a user’s relationship with the app.
A shortening session length paired with a widening session interval is a reliable early warning sign that users are coming back less often and staying for less time. That pattern almost always precedes a churn event.
Tracking these metrics at the cohort level rather than as aggregate averages reveals which segments are drifting and when the drift started, which makes diagnosis and intervention far more precise.
Retention rates: Day-1, Day-7, and Day-30
Retention rate measures the percentage of users who return to the app after their first session. The shape of the drop-off curve is more diagnostic than any absolute figure, and each inflection point diagnoses a different stage of the user journey.
A sharp drop from Day-1 to Day-7 usually points to an onboarding problem: users completed the install but did not understand the value proposition quickly enough to return.
A steeper-than-expected drop from Day-7 to Day-30 often indicates a product-fit gap, where users understood the concept but did not find enough reason to build a habit. Each stage calls for a different fix, so tracking all three intervals separately is essential.
Deeper signals: feature adoption, screen flow, and push opt-in rate
Feature adoption rate and screen flow analysis
Feature adoption rate measures the percentage of active users who engage with a specific feature during a defined period. It is one of the most underused metrics in mobile product management and one of the most revealing.
Low feature adoption often means one of two things: users do not know the feature exists, or they found it and did not see the value.
Screen flow analysis, which tracks the sequence of screens users navigate before dropping off, helps separate those two diagnoses. If users are reaching a feature’s entry point and then abandoning, the feature itself likely has a usability or value problem.
If they are never reaching the entry point at all, the issue is discovery. Knowing which problem you are solving changes the fix entirely: one calls for product work, the other calls for in-app messaging or personalized mobile marketing nudges.
Push opt-in rate and in-app message conversion rate
Push notification opt-in rate is a channel-health metric that functions as a ceiling on every re-engagement campaign you will ever run. If only 30% of your users have opted into push, your best-performing push campaign will only ever reach 30% of your audience, and no subject line, send-time optimization, or segmentation strategy changes that math.
In-app message conversion rate completes the picture. Push gets users back into the app; in-app messages guide behavior once they are there.
A high push open rate paired with low in-app conversion usually signals a mismatch between the message promise and the in-app experience. Both metrics belong in the same weekly review because they are two halves of the same re-engagement loop.
Real-world examples: What happens when brands act on these metrics
Acting on engagement signals rather than scheduled campaigns is the operational difference between teams that retain users and teams that chase them. A few patterns illustrate what that looks like in practice.
Consider a fintech app where Day-7 retention is declining but Day-1 retention looks healthy. Session depth data reveals that users who do not connect a bank account during their first session almost never return after Day-3.
The diagnosis is clear: the value exchange requires a commitment that onboarding is not motivating effectively enough. The fix is a behavioral trigger, a personalized in-app prompt at the moment users show hesitation, not a batch email three days later.
DeFacto applied comparable logic in ecommerce by tying behavioral app push notifications directly to user actions rather than broadcast schedules, driving an 8X higher conversion rate.
The metric that unlocked that result was not a new channel; it was a sharper read on behavioral signals that showed exactly when and why users were disengaging.
Wondering which leading indicator is the right starting point for your app? Book a personalized demo and we’ll walk through session depth, feature adoption, and push opt-in benchmarks against your own retention curve.
Feature adoption signals can also surface friction points that would otherwise stay invisible. An ecommerce app with a wishlist feature seeing low adoption despite strong session frequency has a discovery problem, not a product problem.
Surfacing the feature through a contextual in-app message at the right moment in a browsing session, rather than burying it in a navigation menu, directly addresses the gap between what users are doing and what the product wants them to do.
Lenovo used exactly this kind of in-app personalization to remove purchase barriers, driving measurably higher engagement outcomes.
The same signal-to-trigger logic extends across verticals. In ecommerce, an abandoned cart is one of the highest-intent negative signals a user can send, and a coordinated response, a timely push paired with a follow-up in-app reminder and, if needed, an email, recovers revenue that a next-morning batch send would miss entirely.
In travel, an abandoned search or a viewed-but-unbooked itinerary is the equivalent moment: intent is high and perishable, so the value of acting within minutes rather than days is enormous.
Subscription and media apps face a related problem in which the decisive signal is a widening gap between content sessions.
A streaming or news app that detects a regular viewer slipping from daily to weekly visits can trigger a personalized re-engagement journey, surfacing a saved title or a relevant new release, well before that user reaches the point of cancelling.
Loyalty and gamification mechanics work the same way: progress toward a reward, a streak about to break, or points nearing expiry are all high-intent moments, and a nudge fired at exactly the right threshold does far more than a generic weekly reminder.
The consistent pattern across these examples is that cross-channel behavioral triggers outperform scheduled broadcasts.
When a metric threshold, such as a drop in session frequency, a stalled feature adoption rate, or an abandoned cart, fires a coordinated response across push, in-app messaging, and email simultaneously, the intervention reaches users at the moment of maximum relevance rather than the moment of maximum convenience for the marketing calendar.
Each of those strong signals maps to a specific part of the platform that catches it and a specific action that answers it.
This is where the theory becomes operational: the customer data platform detects the signal, and Insider One AI™ and Architect decide and deliver the response in the same system and the same moment.
How each strong signal maps to Insider One
| Strong intent signal | What detects it | What acts on it |
| Bank account not connected by session 1 (fintech) | CDP unifies the behavioral event across app and web | Architect fires a real-time in-app prompt at the hesitation moment |
| Add-to-cart, then a stall | Predictive AI segment flags the user as likely to abandon | Coordinated push, in-app, and email trigger in a single journey |
| Core feature never reached | Screen-flow and feature-adoption data in the CDP | Contextual in-app nudge that surfaces the feature in the moment |
| Session interval widening | AI churn-risk segment detects the slipping pattern | Journey re-engages the user before they go dark |
Turning metrics into a repeatable engagement system
A tiered monitoring cadence
Not every metric needs the same review frequency. A practical cadence looks like this:
- Daily: Automated dashboards for DAU/MAU ratio, crash rate, and push delivery success rate to surface acute problems that need same-day response
- Weekly: Session depth, feature adoption rate, in-app message conversion rate, and push opt-in rate to track the health of your engagement loops and inform the following week’s campaign decisions
- Quarterly: Cohort-level LTV, churn trend lines, and Day-30 retention by acquisition channel to inform product roadmap prioritization and budget allocation
The daily layer catches fires. The weekly layer guides execution. The quarterly layer shapes strategy. Running all three without separating them creates noise; separating them without connecting them creates silos.
Closing the gap between detection and action
Detecting a metric shift and acting on it fast enough to matter are two different capabilities. A team that spots a retention dip in a Thursday morning dashboard review and launches a corrective campaign the following Tuesday has already lost the window, because the users who were drifting have drifted further in the intervening days.
This is where artificial intelligence (AI)-powered engagement platforms change the operational calculus.
Insider One is built on a customer data platform (CDP) that unifies every behavioral, transactional, and profile signal into a single real-time customer view, and that shared data foundation is what lets detection and response happen in the same system rather than being stitched together across disconnected point tools.
On top of that foundation, Insider One orchestrates messaging across the full channel set a mobile user actually touches: app and web push, in-app messaging, email, SMS, WhatsApp, and on-site web experiences.
Insider One AI™ turns that signal grading into automation. The rule from earlier still holds: strong, high-intent signals should trigger a response in real time, while low-intent noise should not trigger at all, and the platform grades every signal against that line for you.
In practice it surfaces predictive segments, including users likely to disengage and users showing rising purchase intent, generates and personalizes message content with generative AI, and recommends the next-best channel and send time for each individual, then fires the response the instant the behavior happens rather than at the next weekly review.
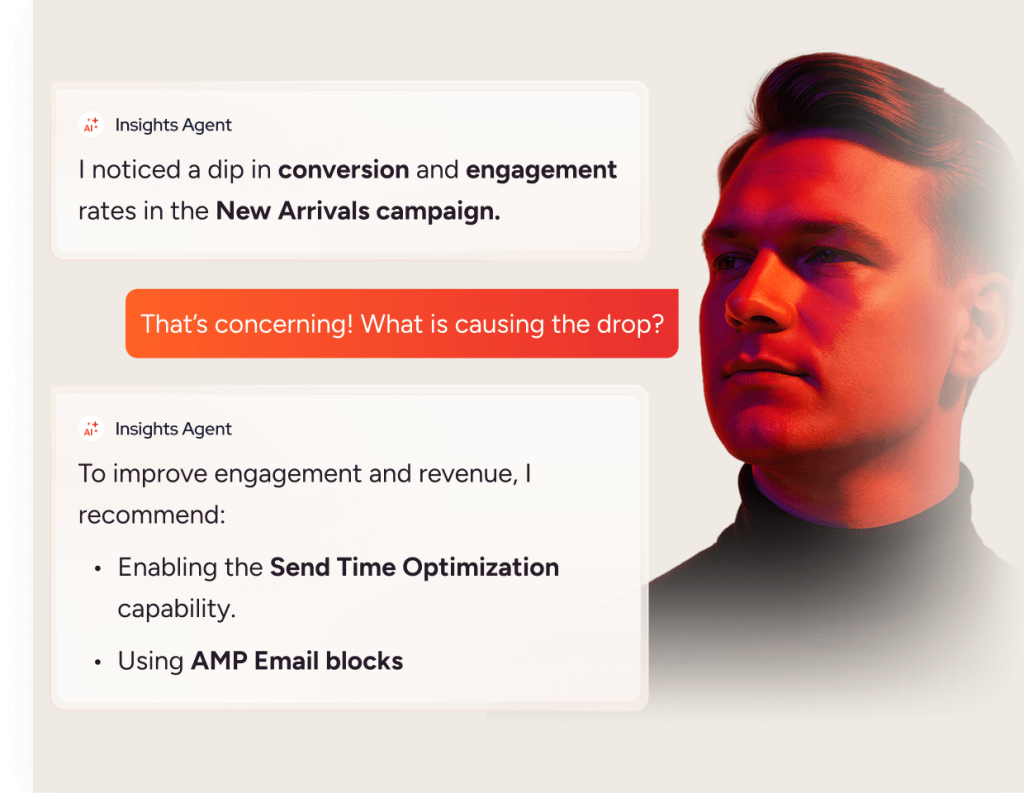
Teams using Architect can design cross-channel journeys that fire based on metric thresholds: session interval widening past a defined limit, feature adoption falling below a target rate, or a Day-7 milestone approaching without a return visit.
Because the metric detection and the personalized response live in the same system, the CDP that sees the signal and the AI decision layer that answers it, there is no handoff to lose.
A stitched-together stack detects the shift in one analytics tool, exports a segment, hands it to a separate email or messaging platform, and then waits for someone to schedule the send, which is exactly the multi-day delay that lets a drifting user drift further.
Insider One collapses that chain into a single real-time loop, which is what actually closes the detection-to-action gap rather than just narrowing it.
This approach also connects what is happening in the app to what is happening across every other channel a user touches, giving product and marketing teams a unified view of the engagement lifecycle rather than separate dashboards for each channel.
That unified view is what makes gamified mobile engagement strategies and loyalty mechanics work at scale, because the system knows which users to target, when to reach them, and which channel gives each message the best chance of landing.
This is also the clearest way to separate genuinely unified platforms from suites of acquired tools that share a logo but not a data model.
Because Insider One reads from and writes to one customer profile, a signal detected in the app can trigger a coordinated response on WhatsApp or email in the same instant, with no batch export, no overnight sync, and no reconciliation between systems.
Competing stacks that bolt a messaging tool onto a separate analytics tool onto a separate customer database cannot close that loop at the speed the moment requires.
If you are evaluating platforms side by side, test the things that actually determine engagement outcomes rather than feature checklists: whether the underlying customer data is genuinely unified or merely connected, how quickly a detected signal can fire a live cross-channel response, how many channels are natively orchestrated from that single profile, and how much of the segmentation, content, and channel selection the AI can handle on its own.
Those four questions tend to expose the gap between an all-in-one platform and a collection of integrations.
If you want to see how Insider One’s Architect and Insider One AI™ turn live customer data into coordinated, revenue-driving experiences, book a personalized demo to see the exact use cases, decision logic, and growth levers most relevant to your team.
Frequently asked questions
It depends on the category. Social and entertainment apps generally target a higher ratio because daily habitual use drives the business model.
Utility, productivity, and fintech apps typically perform well at a lower ratio. Setting a benchmark without accounting for your category will lead to either false alarms or misplaced confidence.
Start with Day-7 retention rate and session frequency. Day-7 retention tells you whether users found enough value to come back after the initial novelty wore off, and session frequency tells you whether that value is durable.
Both are leading indicators that give you time to act before churn shows up in your revenue numbers.
Opt-in rate is most effectively improved at the moment of the native system prompt. The timing, context, and preceding experience matter more than any in-app copy test.
Presenting the opt-in request after a user has experienced a clear product value moment, such as a successful transaction, a completed task, or a personalized result, produces meaningfully higher acceptance rates than presenting it immediately after install.
Session length measures time spent in the app per visit. Session depth measures how many screens or actions a user completes per session.
They do not always move together: a long session spent on a single screen often indicates friction rather than engagement, while a shorter session with high screen depth often indicates efficient, purposeful use.
Yes, in the right context. Installs, store page views, and total registered users are legitimate measures of acquisition reach and campaign performance. They become dangerous only when they are used as proxies for engagement or product health, because a rising install count can easily mask falling retention. Report them as acquisition metrics, and judge engagement on signals that carry real user intent.
A leading indicator predicts what users are about to do, so it gives you time to intervene; session frequency, feature adoption rate, and push opt-in rate are examples. A lagging indicator confirms what has already happened, such as churn rate, lifetime value, and revenue per user. Leading indicators are where you act; lagging indicators are where you keep score.
A strong signal is a high-intent action that sits close to value creation, such as adopting a core feature, connecting a bank account, adding an item to a cart, or opting into push right after a positive experience. Weak or low signals are ambient activity, like a raw session count or an install, that could mean almost anything. Building triggers on strong signals, and merely logging weak ones, is the fastest way to turn metrics into action.

Keep Reading
4 min.

Chris Baldwin
3 Feb 2026
8 mins.
Chris Baldwin
8 Oct 2026
8 mins.
Chris Baldwin
8 Oct 2026