Omnichannel Marketing Metrics: How to Measure Success

Updated on 11 May 2026
9 min.
Table of Contents
Most Popular


Summary
| Single-channel metrics like open rates and last-click attribution often misrepresent what actually drives purchases, leading to poor budget decisions. More useful metrics include cross-channel conversion rate, time-to-purchase, CLV by channel mix, and repeat purchase rate. Effective attribution depends on choosing the right model for your data scale and sales cycle, while incrementality testing is essential for measuring true impact. None of this works reliably without a unified CDP that connects customer identities across channels and devices. |
The paid team declares a campaign a winner, while the customer relationship management (CRM) team looks at the same period and flags a retention problem. But neither team can answer confidently when leadership asks which number is right. This is where omnichannel measurement breaks down, not in the dashboards, but in the logic underneath them.
The problem isn’t a lack of data. Most marketing organizations sitting across three or more channels are drowning in channel-level metrics. The problem is that almost none of those metrics reflect the journey a customer actually took. They reflect the last interaction a platform could measure, or the first one it wanted credit for.
Building a connected measurement framework means replacing that fragmented view with one that maps behavior across touchpoints to real business outcomes, and that’s what this piece is designed to help you do.
Why single-channel key performance indicators (KPIs) lie to you
How attribution models erase mid-funnel contribution
Consider a customer who browses a product page on your site on a Tuesday, receives a personalized email on Thursday, and completes the purchase in-store on Saturday. Under last-click attribution, the in-store channel or the email gets full credit, depending on how you’ve configured your tracking. Under first-touch, the website visit claims the conversion.
The behavioral logic that actually drove the purchase, the email that re-engaged a warm browser, disappears from the record entirely.

This isn’t an edge case. It’s the structural reality for any brand running simultaneous campaigns across web, email, paid media, and physical retail. Rule-based attribution models were designed for simpler funnels. When you apply them to multi-touchpoint journeys with offline components, they don’t just simplify the picture, they actively distort it by concentrating credit at the endpoints and leaving mid-funnel channels invisible.
The budget and retention consequences of siloed reporting
When each channel team reports independently, disagreement isn’t a bug, it’s a built-in problem. Paid media optimizes for in-platform conversions to declare campaign efficiency. CRM looks at the cohort of customers that campaign reached and sees low repeat purchase rates and declining CLV. Both numbers are correct within their own frame. But neither tells you what’s actually happening to the customer relationship.
The downstream effect shows later when the budget gets shifted toward channels that appear to convert, which are usually the ones capturing the intent other channels created. Meanwhile, the retention signals in the CRM data go unread, or arrive too late to act on. Siloed reporting doesn’t just produce confusion, it also systematically misallocates spend and misses opportunities to intervene before a customer churns.
The core omnichannel metrics that reflect journey health
Four KPIs that signal what’s actually working
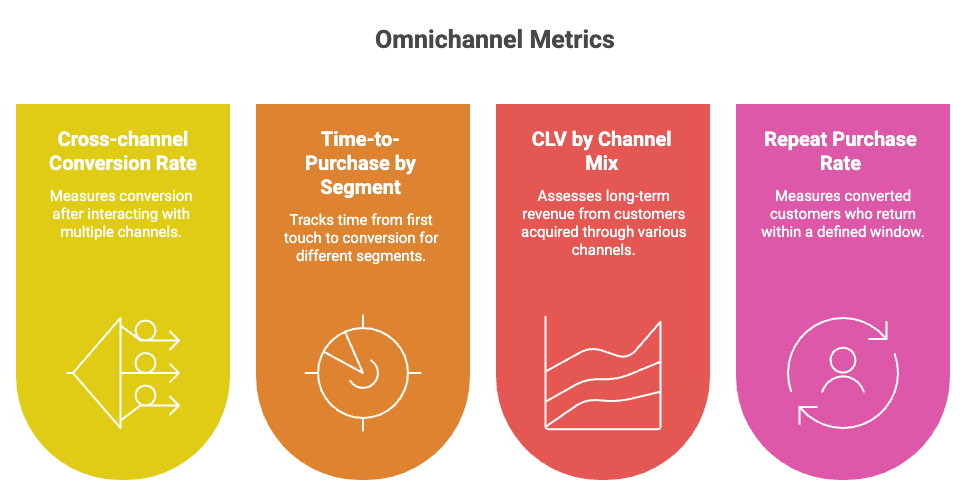
Moving beyond channel-level reporting means tracking indicators that span the full journey. Four metrics do the most work:
• Cross-channel conversion rate: The share of customers who convert after interacting with two or more channels, compared to single-channel paths. This tells you whether your channel orchestration is adding value or creating noise
• Time-to-purchase by segment: How long different customer segments take to move from first touch to conversion. Narrowing this gap is one of the clearest signals that your journey design is working
• CLV by channel mix: The long-term revenue contribution of customers acquired or retained through different combinations of channels. This is the metric that separates channels that drive revenue from channels that drive transactions
• Repeat purchase rate: The share of converted customers who return within a defined window. A rising conversion rate paired with a falling repeat purchase rate is one of the clearest warnings that you’re over-investing in acquisition relative to retention
Distinguishing vanity metrics from journey-health signals
Open rates and impressions aren’t useless, but they’re activity signals, not outcome signals. Treating them as primary KPIs in a leadership dashboard tells you what customers saw, not what they did as a result.
The metrics that belong in a leadership view are the ones that connect channel activity to business outcomes: revenue per unified customer profile, cross-channel engagement drop-off by journey step, and CLV trajectory by cohort.
A practical weighting framework puts those journey-level metrics at the top of the reporting hierarchy and uses channel-level metrics, open rate, click-through rate (CTR), impressions as diagnostic inputs below them. When a journey-level KPI moves, you drill into the channel metrics to find the cause. You don’t let a strong email open rate mask a failing journey.
Choosing the right attribution model for your business
Rule-based models: when and how to use them
Rule-based attribution models, linear, time-decay, and U-shaped (also called position-based), are deterministic. They assign credit according to a predefined formula, which makes them transparent and easy to explain to stakeholders. Linear attribution spreads credit equally across all touchpoints, which prevents any single channel from dominating the story.
Time-decay weights more recent interactions more heavily, which suits shorter sales cycles where the last few touchpoints are genuinely more predictive. U-shaped models split the majority of credit between first and last touch, which works reasonably well for brands where awareness and conversion are the two moments that matter most.
However, all rule-based models encode assumptions that may not reflect your customers’ actual behavior. They’re a reasonable starting point for teams that don’t yet have the data volume to support statistical modeling, but they should be treated as working hypotheses rather than ground truth.
Data-driven attribution: when scale justifies the complexity
Data-driven, or algorithmic attribution uses your actual conversion data to calculate the marginal contribution of each touchpoint. It doesn’t assign credit based on position. It learns which combinations of channels and sequences are most predictive of conversion.
For teams running campaigns at scale across five or more channels with conversion volumes high enough to train a model, this approach produces more accurate and more actionable results than any rule-based alternative.
The threshold question is data volume. Data-driven models need sufficient conversion events to produce stable estimates. The exact number varies by implementation, but the principle holds. If your funnel is too narrow, the model will overfit to noise. The suggestion will be to start with rule-based, instrument everything rigorously, then graduate to algorithmic attribution when your data supports it.
Incrementality testing as the validation layer
Attribution models, regardless of type, measure correlation. Incrementality testing measures causation. A holdout test withholds a channel or campaign from a randomly selected group of customers and measures the difference in outcomes between the exposed group and the holdout. The gap is the incremental lift that the channel or campaign actually produced, not the lift your attribution model assigned to it.
Running a basic holdout test requires three things: 1) a sufficiently large audience to split without statistical noise, 2) clean suppression logic so the holdout group genuinely doesn’t receive the treatment, and 3) a consistent measurement window. The results won’t always be comfortable. Channels that look strong in your attribution model sometimes show modest or near-zero incremental lift. That’s not a failure of the test, it’s the test working correctly, and it’s information you need before the next budget cycle.
Unifying data so measurement is possible
Why a customer data platform (CDP) is the prerequisite, not an upgrade
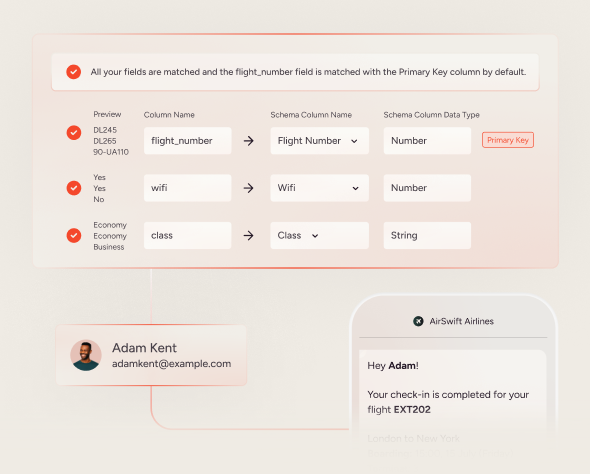
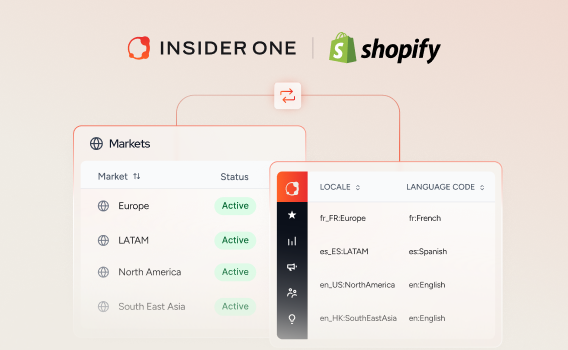
Customer Data Management, the function of resolving, unifying, and activating customer identity across sources, is what makes omnichannel measurement trustworthy rather than theoretical. Without a unified customer profile that connects a person’s behavior across devices, channels, and offline touchpoints, your attribution is matching touchpoints to sessions, not to people.
A customer who browses on mobile, clicks an email on desktop, and converts in-store appears as three separate actors in a fragmented data stack.
Identity resolution is the specific capability that collapses that fragmentation. When a known identifier, email, loyalty ID, or phone number, is present, it stitches historical and real-time behavior into a single profile. When it isn’t, probabilistic matching bridges the gap.
Neither is perfect, but both are meaningfully better than the alternative which is treating every device and every channel as its own isolated audience.
The three-layer data stack for omnichannel measurement
Reliable measurement requires three things working in sequence. First, event ingestion and normalization. Every touchpoint, web, app, email, in-store, call center, needs to emit structured, consistently formatted data that your measurement layer can actually read.
Second, a single customer ID that persists across all those sources and resolves anonymous and known behaviors into a coherent record.
Third, a reporting layer that maps touchpoints to business outcomes, not just to channel activity, revenue, CLV trajectory, purchase frequency, rather than clicks and impressions in isolation.
Teams that skip the first or second layer and go straight to reporting will end up with dashboards that look comprehensive but measure the wrong thing. The data looks clean because everything in the stack is consistent, consistently incomplete.
Building a measurement cadence that improves performance over time
A practical review rhythm
Measurement only drives decisions when it’s reviewed on a cadence that matches the pace of campaign execution. A practical rhythm looks like this:
• Weekly: Channel-level diagnostics, delivery, CTR, drop-off by step. Owned by channel leads. With purpose of identifying acute problems before they compound
• Monthly: Journey-level attribution review, cross-channel conversion rate, time-to-purchase, revenue per unified profile. Owned by the head of marketing or growth. With purpose to validate whether orchestration decisions made last month improved outcomes
• Quarterly: CLV cohort analysis, how are customers acquired in previous quarters performing against CLV benchmarks? Which channel mixes produced the most durable customers? Owned by senior marketing leadership with finance involvement. With purpose to inform budget allocation and channel investment for the next planning cycle
Assigning ownership to each review level matters as much as defining the cadence. When every team is responsible for every metric, no one is accountable for any of them.
Closing the loop between measurement and iteration
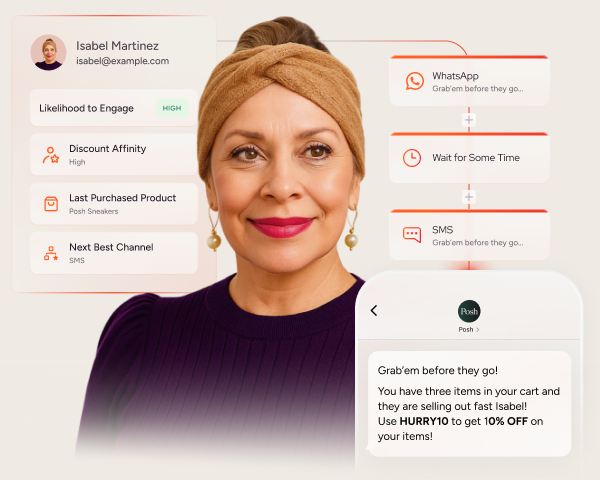
Measurement that doesn’t change the next campaign is just reporting. Closing the loop means treating each attribution review as an input to journey orchestration. Adjusting channel weighting, restructuring touchpoint sequences, or rerouting segments that show high drop-off rates at a specific step. For teams operating at scale, artificial intelligence (AI)-powered platforms can automate parts of this process, using live attribution signals to surface next-best-action recommendations rather than waiting for a monthly review cycle to surface the pattern manually.
Slazenger, for example, achieved 49X return on investment in eight weeks by working with Insider One on omnichannel journey orchestration that connected customer behavior signals across channels to campaign decisions in near-real time. That kind of result isn’t about any single channel performing well, it’s about the measurement and activation loop being short enough that insights translate into action before the opportunity closes.

MadeiraMadeira took a similar approach with Architect and achieved 52X return on investment, demonstrating that the value of unified measurement compounds when it’s connected to automated journey execution rather than sitting in a static report.
Proving journey-level return on investment to leadership requires more than a better dashboard, it requires a measurement framework built on unified data, calibrated attribution, and a review cadence that connects findings to decisions. Insider One’s platform brings together Customer Data Management, Architect for omnichannel journey orchestration, and Sirius AI™ to help marketing teams move from channel-level reporting to connected measurement that actually changes how they spend and where they grow. Book a personalized demo to see how Insider One’s attribution and journey analytics capabilities map to your specific channel mix and measurement goals.
FAQs
Multichannel metrics measure performance within individual channels, email open rates, paid media click-through rates, push notification delivery. Omnichannel metrics measure what happens across channels: how customers move between touchpoints, which combinations of channels produce the best CLV, and whether your orchestration is accelerating or slowing the path to purchase. The distinction isn’t semantic, it determines whether your dashboard reflects channel activity or customer behavior.
The investment threshold is lower than most teams assume. If you’re running coordinated campaigns across three or more channels and those campaigns share audiences, you already have a cross-attribution problem worth solving. The complexity of your measurement framework should scale with your data volume and team maturity, but the core question, which combination of channels is actually driving outcomes?, becomes relevant as soon as two channels share a customer.
You can measure channel-level performance without a customer data platform. You can’t measure omnichannel success without one, at least not with any reliability. Cross-channel attribution requires a common identity layer, a way to recognize the same person across different systems. Without that, you’re matching touchpoints to devices, not to customers, and your attribution reflects technical fragmentation rather than actual behavior.
Keep it to five to seven metrics maximum. Prioritize CLV by channel mix, cross-channel conversion rate, repeat purchase rate, time-to-purchase by segment, and revenue per unified customer profile. Channel-level metrics, open rates, impressions, click-through rates, belong in operational reports, not in the view that leadership uses to make budget decisions.

Keep Reading
7 min.
Muharrem Derinkok
4 Jun 2026
11 min.
Chris Baldwin
2 Jun 2026
4 min.
Chris Baldwin
3 Feb 2026