

 Platform Overview

 Integration Hub

 Agent One™

 Agent One™ Teams

 Customer Data Management

 Personalization

 Journey Orchestration

 Reporting & Data

 Behavioral Analytics

 Web
Web

 Email
Email

 Site Search

 Conversational CX

 WhatsApp

 Web Push

 InStory

 App
App

 SMS & RCS

 Join the $0 Migration Movement™

 The Insider One Difference

 Compare Vendors

 Switch to Insider One

 Success Story

 Retail & Ecommerce

 Financial Services

 Travel & Hospitality

 Beauty & Cosmetics

 Automotive

 Telecommunications

 Total Economic Impact™ Study

 Blog
Blog

 E-Books & Guides

 Events

 Glossary
How to Actually Measure Cross-Channel Marketing Analytics

Updated on 10 Aug 2026
11 min.
Table of Contents
- Summary
- Why channel-level dashboards are lying to you
- The four layers of a unified cross-channel analytics framework
- Choosing the right attribution model for your journey complexity
- The key performance indicators (KPIs) that actually earn budget decisions
- Building measurement that adapts to privacy changes
- Why Insider One for cross-channel measurement
- Frequently asked questions
Most Popular
Summary
Cross-channel analytics provides a complete view of the customer journey by unifying data across channels and measuring how each touchpoint contributes to conversions. Using first-party data and advanced attribution models helps marketers make more accurate, data-driven investment decisions.
Your email team reports a 28% conversion rate. Your paid team reports a 31% conversion rate. Your SMS team reports a 19% conversion rate. Add those numbers together and you are claiming to convert 78% of your audience through three channels alone, which is almost certainly not happening.
What you are actually measuring is the same customer three times, with each platform awarding itself full credit for a conversion that took all three touchpoints, and probably several more, to complete.
This is the central problem with per-channel reporting, and it compounds as your channel mix grows. Cross-channel marketing analytics is not about pulling numbers from every platform into a single spreadsheet.
It is about building a measurement architecture that shows you how channels work together across a customer’s journey, which ones accelerate decisions, which ones close, and which ones consume budget without meaningfully contributing to either.
For teams using Insider One, that architecture is strongest inside Insider’s AI-powered Growth Management Platform, where unified customer data, Audience segmentation, cross-channel journeys, and reporting stay connected in one platform instead of being split across separate channel tools and disconnected dashboards.
That matters because the same insight can move from measurement into an Audience segment and then into an Architect journey, rather than stopping at a dashboard. This is a structural problem, and it requires a structural answer that connects measurement to execution, not measurement in isolation.
Why channel-level dashboards are lying to you
The double-counting problem
Every platform reports the world from its own perspective. Your email service provider (ESP) counts a conversion if the customer clicked an email in the last 30 days. Your paid media platform counts a conversion if the customer saw an ad in the last seven days. Your SMS tool counts a conversion if the customer received a message in the last 48 hours. One customer, one purchase, three claimed conversions, and a reporting environment that flatters every channel simultaneously.
When you report channel performance in isolation, you are not measuring marketing effectiveness. You are measuring which platform has the most aggressive attribution window. This is not a minor rounding error: it distorts budget allocation and inflates the apparent return on ad spend (ROAS) of every channel at once.
The practical consequence is that it becomes structurally impossible to identify which channel is genuinely driving incremental revenue versus which is simply present at the moment of conversion.
How iOS and cookie changes created journey blind spots
Cookie deprecation and Apple’s App Tracking Transparency (ATT) framework have compounded the problem significantly.
When a meaningful portion of your audience becomes untrackable mid-journey, last-click and last-touch models do not just become imprecise; they become systematically misleading. If the middle of the journey is invisible, the last visible touchpoint absorbs credit it did not fully earn, and any budget decisions made on that basis are built on a distorted foundation.
Channels appearing later in the funnel, particularly email and paid retargeting, tend to be structurally over-credited in environments where mid-journey signals are missing.
Why the channel mix itself obscures the picture
Any cross-channel marketing strategy that relies on last-click attribution in a privacy-constrained environment is measuring the shadow of a journey, not the journey itself.
As channel counts grow, the gap between what per-channel dashboards report and what is actually happening widens. A customer may interact across web, email, push notifications, and paid media before converting, yet each channel’s dashboard presents itself as the primary driver.
The result is a reporting environment where every channel looks effective in isolation and none of them can be confidently compared against the others.
The four layers of a unified cross-channel analytics framework
Unifying cross-channel measurement is not a dashboard configuration problem. It is a data architecture problem with four distinct layers, and skipping any one of them breaks the model downstream.
Layer 1 – Identity Resolution
Before you can measure a journey, you need to know you are measuring the same person across sessions, devices, and channels. Identity resolution stitches together known identifiers, such as email addresses, customer IDs, and phone numbers, with anonymous behavioral signals from web and app sessions so they can be understood inside a unified customer database rather than as isolated channel records.
In Insider One, this is where Customer Data Management helps turn separate channel records into profiles that teams can segment, analyze, and activate.
Without this foundation, a customer who opens an email on their phone and converts on their laptop looks like two separate users in your data.
Your cross-channel conversion path becomes invisible, and your attribution logic operates on fragmented identities rather than coherent customer records that can support segmentation, reporting, and follow-up action.
Layer 2 – Event Normalization
Every channel produces events like opens, clicks, sessions, purchases, and form submissions. In Insider One, this layer depends on consistent data collection and data ingestion so those events can be captured in a shared structure before attribution or activation begins.
What counts as a “session start”? What constitutes a “conversion event”? Standardizing this across email, push notifications, SMS, paid media, and web means your analytics layer is comparing equivalent actions, not superficially similar ones.
This step is unglamorous, but it is where most measurement frameworks quietly fail if collection and ingestion rules are inconsistent across channels.
Layer 3 – Attribution Modeling
Once you have unified identities and normalized events, you can apply attribution logic that distributes credit across the actual journey rather than the last visible touchpoint.
In Insider One, native channel analytics can read view-through, click-through, and where relevant direct click-through signals within defined attribution windows and impression rules across supported campaigns, which is more precise than treating every touchpoint as if it were measured the same way.
More advanced data-driven or algorithmic modeling can still require broader analytics inputs outside the platform, so it is important to separate what Insider One measures natively from what a wider measurement stack may contribute. The specific model you choose depends on journey complexity, which the next section covers in detail.
Layer 4 – Single Reporting Surface
The final layer is where data becomes decision-making. A single reporting surface consolidates journey performance across all channels so that marketing, analytics, and leadership teams are working from the same numbers, and it becomes actionable when the same data can immediately create an Audience segment, suppress an over-messaged cohort, or trigger a follow-up Architect journey.
This is where omnichannel marketing automation infrastructure becomes relevant: platforms that natively connect analytics, segmentation, and cross-channel execution reduce the reconciliation overhead that comes from stitching together separate tools after the fact.
Choosing the right attribution model for your journey complexity
When do Rule-based Attribution Models work
Rule-based attribution models, including first-touch, last-touch, linear, and time-decay, are straightforward to implement and interpret.
- First-touch credits the channel that initiated the journey;
- Last-touch credits the channel closest to conversion;
- Linear distributes credit equally across all touchpoints;
- Time-decay weights touchpoints more heavily the closer they occur to conversion.
For short conversion cycles, such as a two-day window between awareness and purchase, last-touch or time-decay models are often sufficient. The journey is compact enough that the final touchpoint genuinely deserves most of the credit.
For longer journeys involving multiple weeks and channels, these models become structurally incomplete. They either erase early-journey awareness work or flatten meaningful differences in channel contribution.
When to Switch to Data-Driven Attribution Models
Data-driven, or algorithmic, attribution uses actual conversion path data to calculate how much each touchpoint contributes to the outcome, based on statistical modeling of paths that converted versus paths that did not. This approach handles long, complex journeys more accurately and surfaces the channel sequences that drive conversion, not just the individual channels in isolation.
The practical threshold for switching is usually journey length and data volume. If your average conversion cycle spans more than a week and involves four or more touchpoints, rule-based models will increasingly misrepresent channel contribution.
Data-driven models require sufficient conversion event volume to produce reliable output, typically several thousand conversions per modeling period.
Running models in parallel
Running two models simultaneously, for example time-decay alongside a data-driven model, is genuinely useful. Where the models agree, you have confidence. Where they diverge, the gap reveals something meaningful about how a channel functions.
A channel that ranks highly on time-decay but far lower on data-driven attribution is probably a strong closer but a weak influence earlier in the journey. A retailer may see paid social create the first visit while onsite recommendations, cart recovery, and follow-up journeys do the closing, while a travel brand may see app and web remarketing work together across a longer booking cycle.
Divergence is a signal worth reading, not an error worth resolving. This pattern is explored further in omnichannel marketing examples that illustrate how different channel roles play out across the funnel.
The key performance indicators (KPIs) that actually earn budget decisions
Replacing open rates and click-through rates
Open rates and click-through rates (CTRs) are channel-level health metrics. They tell you whether a message reached and engaged someone, but they do not tell you whether that engagement contributed to a sale.
Reporting these to leadership as evidence of marketing effectiveness is a category error, and it explains why analytics teams often struggle to connect their work to business outcomes.
The metrics that belong in budget conversations are different in kind:
• Channel-assisted revenue: total revenue from conversions where a given channel appeared anywhere in the journey, not just at the final click
• Incremental lift per channel: revenue attributable to a channel above what would have occurred without it, measured through holdout testing
• Customer acquisition cost (CAC) by channel sequence: not just cost per acquisition by channel, but cost per acquisition for specific multi-touch sequences, which reveals which combinations are efficient
• LTV cohort performance: how the lifetime value of customers acquired through different channel combinations compares over time
Structuring reports leadership can use
The north-star metric framework connects channel-level performance to a single business outcome that executives care about, and it is the structural approach that makes marketing analytics legible to budget holders.
In a productized workflow, those insights can identify high-intent or low-engagement users inside unified profiles, turn them into Audience segments, and then launch or suppress follow-up experiences across web, app, and messaging journeys in Architect.
That is a practical advantage over fragmented alternatives because the same platform can connect measurement, segmentation, personalization, and cross-channel execution without forcing teams to reconcile separate tools before they act.
Rather than presenting a table of channel metrics, you present a hierarchy: the north-star metric such as revenue, customer LTV, or new customer acquisition, then the contributing journey metrics, then the channel performance supporting each.
Philips achieved a 40.1% conversion rate increase with Insider One, a result that became reportable to leadership because it was tied directly to a revenue outcome rather than an engagement metric.

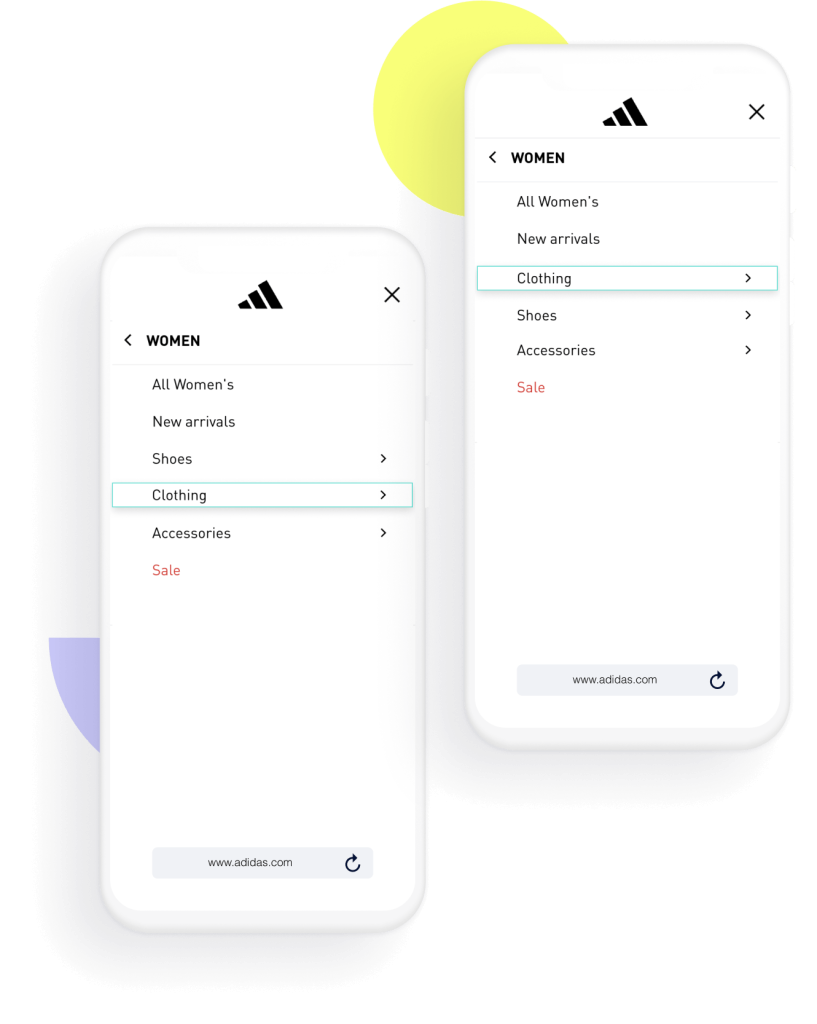
Similarly, Adidas increased average order value by 259% and conversion rate by 13% in one month with Insider One, outcomes that only become visible when measurement spans the full customer journey rather than individual channel performance.
Building measurement that adapts to privacy changes
First-party data as the attribution foundation
The deprecation of third-party cookies and mobile advertising identifiers has made first-party data the non-negotiable foundation of durable attribution.
Email-based identity resolution, where a known email address anchors cross-channel tracking, is the most robust approach for brands with existing customer relationships.
When a customer is known and has given consent, their journey across email, SMS, web push, and on-site behavior can be stitched into a coherent unified profile that supports both measurement and audience decisions.
Consent-gated data collection, progressive profiling, and server-side tracking are the implementation mechanisms that make this work at scale without depending on third-party identifiers that are disappearing from the ecosystem.
Combining MTA, incrementality testing, and MMM
No single measurement method covers the full picture in a privacy-constrained environment.
Multi-touch attribution (MTA) is powerful for known, logged-in users but blind to anonymous journeys. Incrementality testing, which involves running holdout experiments to isolate the causal effect of a channel, is precise but resource-intensive and cannot cover every channel simultaneously.
Marketing mix modeling (MMM) operates at an aggregate level, correlating marketing spend with revenue over time, and works without individual-level tracking but lacks the granularity to optimize individual channel decisions.
The teams building measurement that adapts to privacy changes use all three methods in combination: MTA handles the known-user journey, incrementality testing validates the causal assumptions behind MTA, and MMM provides the top-down view that catches what both methods miss.
Why Insider One for cross-channel measurement
Cross-channel measurement has two failure points no attribution model can fix: identities that never resolve, and findings that never leave the dashboard. Insider One is built around both.
Identity and event normalization. Customer Data Management stitches website, app, email, CRM, POS and contact center data into a single profile. Event formats are transformed as they arrive to prevent duplicate collection, and ingestion analytics exposes every feeding source, so inconsistent collection rules surface before they distort attribution rather than after.
Reporting by role, from one dataset. Custom dashboards are assembled from prebuilt widgets. A marketing view carries clicks, opens and conversion rates; a leadership view carries revenue, churn, AOV and customer lifetime value. Both read the same underlying data, alongside conversion funnel analysis and channel reachability.
Action from the same surface. A cohort identified in reporting becomes an Audience segment, then an entry condition in Architect, on the same profiles with no export step. An over-messaged group becomes a suppression rule. A high-intent group becomes a follow-up journey. Insights Agent watches across channels and surfaces anomalies without being asked.
Scope. Marketing mix modeling and incrementality testing sit outside the platform. Insider One covers identity resolution, native channel analytics and activation; statistical modeling complements that foundation rather than being replaced by it.
Book a demo to trace a conversion path end to end, or take the platform tour first.
Frequently asked questions
Cross-channel measurement is the broader practice of understanding performance across all channels in a coordinated way. Multi-touch attribution (MTA) is one specific method within that practice, distributing conversion credit across multiple touchpoints in a journey. You need cross-channel measurement infrastructure, including identity resolution, event normalization, and a unified reporting surface, before multi-touch attribution produces reliable results. In Insider One, that infrastructure can support unified profiles, segmentation, and journey reporting, while broader attribution methods may still depend on complementary analytics inputs beyond the platform.
The practical signal is journey complexity. If your average customer touches four or more channels over more than a week before converting, and you have sufficient conversion volume to train a model, data-driven attribution can produce more accurate channel credit than any rule-based approach. For shorter, simpler journeys, time-decay or linear models are often sufficient and considerably easier to explain to stakeholders. For Insider One specifically, native reporting is strongest when teams align attribution windows, impression logic, and channel analytics correctly, while fully algorithmic modeling may sit in a broader analytics environment.
The most realistic path is a unified customer data platform or cross-channel marketing platform that ingests events from your existing tools, normalizes them against a shared schema, and provides a single reporting layer. For Insider One, the value is strongest when that shared data also supports Customer Data Management, Audience segmentation, and Architect journeys for use cases such as cart recovery, personalized web and app experiences, and re-engagement messaging instead of ending at reporting alone. This preserves existing channel tools while addressing the structural gaps at the identity and attribution layers. The goal is not necessarily to replace every tool; it is to stop treating each tool’s reporting as the definitive view of performance and to connect insight directly to action.
Start with identity resolution. Before any attribution logic is worth building, you need confidence that you are measuring the same customer across channels. Audit how your key channels pass customer identifiers, identify where the same customer appears under different IDs, and establish a canonical identifier, usually email or a customer relationship management (CRM) ID, that can anchor cross-channel tracking. Everything else builds on that foundation.

Keep Reading
4 min.

Chris Baldwin
3 Feb 2026
10 min.
Chris Baldwin
5 Oct 2026
10 min.

Julia Bouyeure
4 Oct 2026