How to Build a Customer Journey That Maximizes Conversions

Updated on 22 Jan 2026
15 min.
Table of Contents
- Understanding the customer journey
- How to map your customer journey for maximum conversions
- 1. Identify your audience segments
- 2. Track omnichannel touchpoints
- 3. Define conversion goals for each stage
- 4. Identify friction and drop-off points
- 5. Use journey analytics tools to validate patterns
- 6. Prioritize fixes based on impact and effort
- 7. Activate improvements across channels
- 8. Measure performance and iterate continuously
- 9. Build automated customer journeys to scale your improvements
- Implement a solid customer journey mapping process
Most Popular


High-performing marketing teams treat the customer journey as an operational asset.
They integrate data from on-site behavior (page views, search terms, dwell time, add-to-cart actions), CRM activity (lifecycle stage, lead source, scoring), channel engagement (email clicks, push interactions, ad impressions, session frequency), and transaction history (order value, product affinities, discount usage, return patterns).
This combined dataset becomes a single progression path that guides how the journey is personalized for each user.
This is how they’re able to cut drop-offs, lift average order value (AOV), and drive more conversions.
This guide breaks down how to build a winning customer journey.
But first….
Understanding the customer journey
The modern customer journey moves through different stages, from awareness to decision and beyond.
Each stage reflects a different level of intent.
And each transition can have a measurable impact on conversion, AOV, and retention.
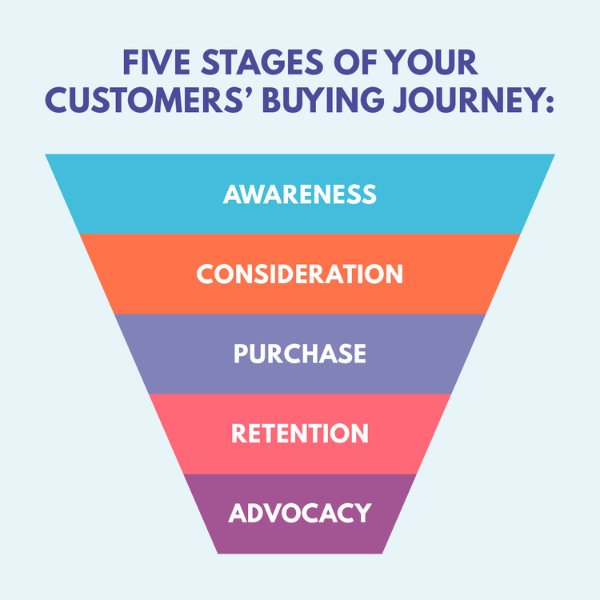
- Awareness: This is the first point of contact. Users find you through search results, AI platforms, social feeds, marketplaces, or referrals. The goal at this stage is to earn qualified attention by giving people a clear reason to take the next step instead of bouncing.
- Consideration: This is where users start evaluating. They compare options, check fit, and look for evidence that your product solves their problem. Most hesitation begins here. Things like long PDPs, unclear value messaging, missing sizing or compatibility details, and inconsistent channel copy can slow momentum and create early drop-off.
- Decision: This is the point where users make the final commitment. Even slight inefficiencies (like slow-loading checkout steps, extra form fields, surprise fees, payment failures, and confusing delivery options) at this stage can hurt your conversions.
- Retention: This stage covers everything that happens after the purchase. It includes how well you keep customers informed about their order, whether the delivery experience matches expectations, how the product performs once it arrives, and how quickly issues are resolved.
- Advocacy: This is the long-term outcome of a strong customer journey. When customers leave positive reviews, share their experience, or refer new users, it signals that the entire lifecycle (from first touch to product usage and beyond) worked as intended.
Understanding these stages at a granular level can help product and marketing teams design journeys that move users smoothly from one step to the next.
And reduce friction at the exact moments where revenue typically leaks.
How to map your customer journey for maximum conversions
Follow these steps to build a customer journey map that drives more conversions.
1. Identify your audience segments
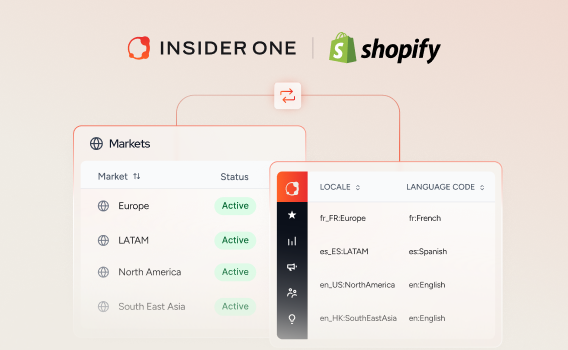
Build segments using real customer data from analytics platforms (behavior), CRM (identity), OMS or Shopify/Magento setup (transactions), and messaging platforms (channel engagement).
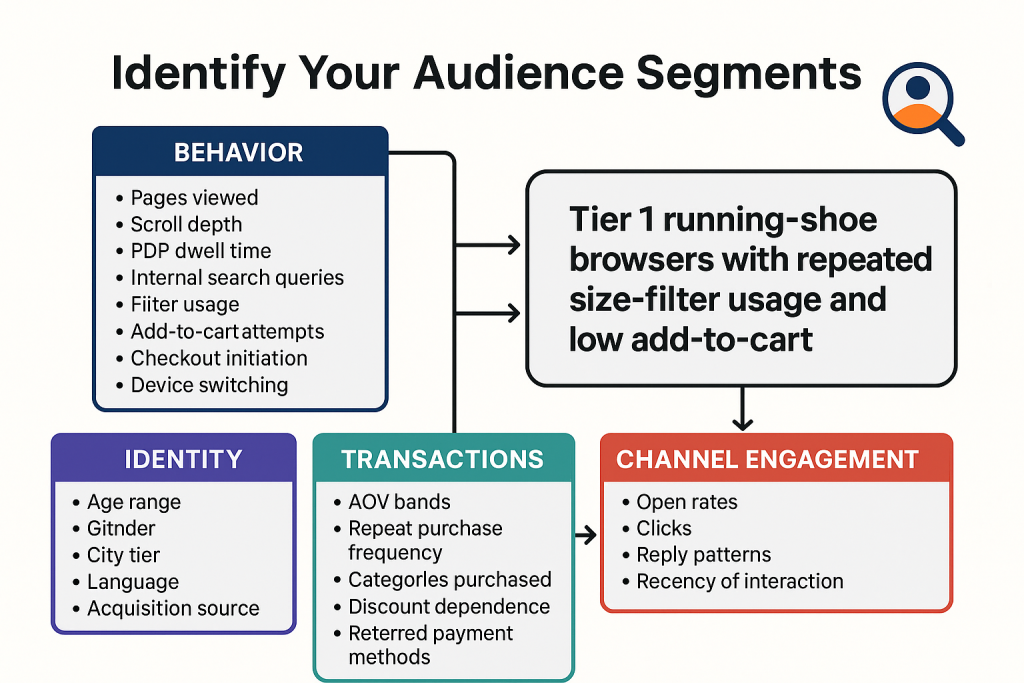
- Start with behavioral data. Track signals like pages viewed, scroll depth, PDP dwell time, internal search queries, filter usage, add-to-cart attempts, checkout initiation, and device switching. These show how users navigate, where they slow down, and which behaviors reliably precede a purchase.
- Layer in demographic and identity data from your CRM. Like age range, gender, city tier, language, and acquisition source. This adds context to behavioral patterns and highlights differences across regions or customer types.
- Add transactional data from your Order Management System (OMS) or ecommerce backend. Like AOV bands, repeat purchase frequency, categories purchased, discount dependence, preferred payment methods, and return rates. This reveals which groups drive long-term value and how their buying path differs from first-time customers.
- Finally, include channel engagement data from your email, push, SMS, and WhatsApp platforms, such as open rates, clicks, reply patterns, and recency of interaction. These signals show which channels each segment responds to.
For example, a footwear brand uses GA4 to spot a segment that repeatedly views running shoes, spends 60+ seconds on PDPs, and applies size filters but rarely adds to cart.
CRM data shows they’re mostly Tier 1 shoppers. Transaction data suggests high AOV potential but low conversion. Messaging data shows strong mobile push engagement.
This becomes the segment:
| “Tier 1 running-shoe browsers with repeated size-filter usage and low add-to-cart.” |
2. Track omnichannel touchpoints
Next, map how each segment actually moves through your channels.
You need to create a clear and chronological view of the steps a user takes from first interaction to purchase.
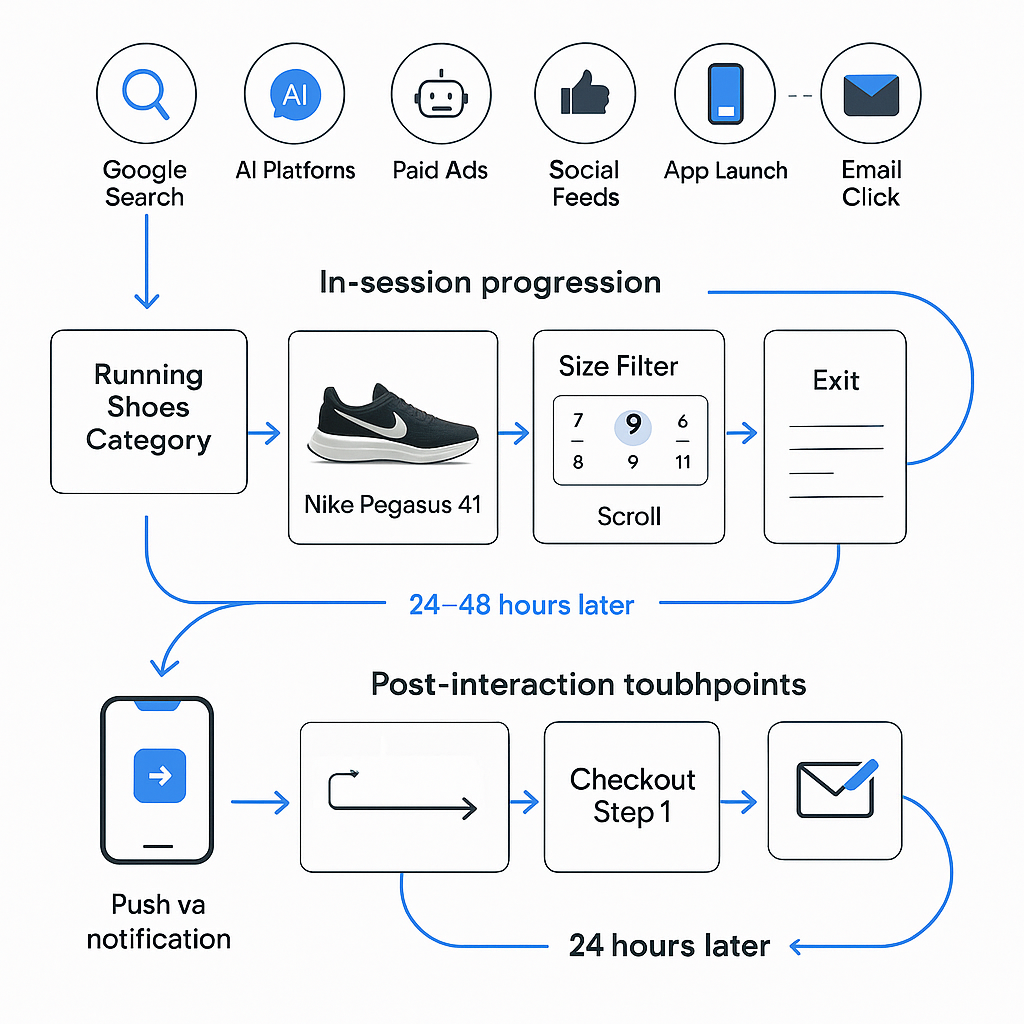
- Start with entry points. Identify where each segment typically begins its journey: search, AI platforms, paid ads, social feeds, app launches, referral links, or email clicks.
- Then map the in-session progression. Use journey analytics tools to visualize the exact sequence of actions users take. For example: Search → Category Page → PDP → Size Filter → Add to Cart → Checkout Step 1. This shows where momentum builds and where it breaks.
- Add channel switches. Track moments where users leave the website and re-enter through another channel. For instance, abandoning checkout on mobile but returning later through an email reminder. These switches are often high-impact friction points.
- Include post-interaction touchpoints such as order confirmations, delivery updates, support interactions, and loyalty engagement. These influence whether users return or churn after the first purchase.
Example:
For the segment “Tier 1 running-shoe browsers with repeated size-filter usage and low add-to-cart,” the journey map shows a clear pattern:
| Google Search → Running Shoes Category → Nike Pegasus 41 PDP → Size Filter (twice) → Scroll → Exit. |
Most re-enter 24-48 hours later through a push notification, return to the same PDP, add the Pegasus 41 Black/White to cart, and then drop off at the delivery-options step.
Post-purchase, they repeatedly open the “Order Out for Delivery” update. This makes it obvious where intent builds, where sizing hesitation appears, which channel pulls them back, and exactly where conversion breaks.
A complete touchpoint map should show:
- Where users enter
- What they do next
- Where they hesitate
- Which channels nudge them forward
- Where drop-off consistently occurs
This sequence becomes the blueprint for identifying friction, designing interventions, and improving conversion at each step.
3. Define conversion goals for each stage
Assign clear conversion goals to every stage of the journey. This can help you turn your map from a visual sequence into a performance framework.
Start by defining what progress looks like at each step.
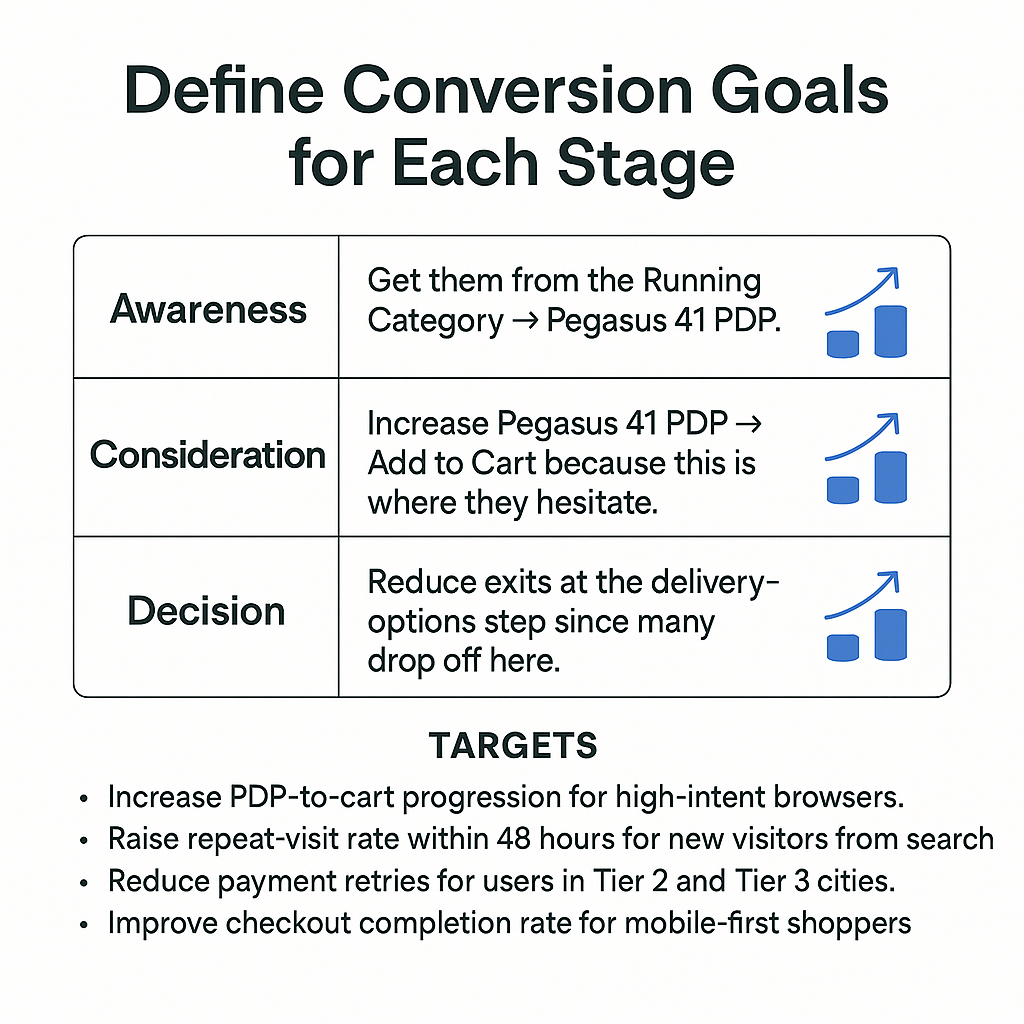
For example, for the segment “Tier 1 running-shoe browsers with repeated size-filter usage and low add-to-cart,” the goals might look like this:
- Awareness: Get them from the Running Category → Pegasus 41 PDP.
- Consideration: Increase Pegasus 41 PDP → Add to Cart because this is where they hesitate.
- Decision: Reduce exits at the delivery-options step since many drop off here.
Then, assign measurable targets tied to those moments. For example:
- Increase PDP-to-cart progression for high-intent browsers.
- Raise repeat-visit rate within 48 hours for new visitors from search.
- Reduce payment retries for users in Tier 2 and Tier 3 cities.
- Improve checkout completion rate for mobile-first shoppers.
Also, tie each target to a business outcome.
For example, by lifting PDP-to-cart progression for a specific PDP, you can increase the overall conversion and reduce wasted traffic from high-intent visitors.
4. Identify friction and drop-off points
With stage-level conversion goals in place, analyze where users consistently stall or exit. This will turn your journey map into a diagnostic tool rather than a linear diagram.
Start by reviewing step-to-step progression inside your analytics or journey platform.
Look at the exact point fail to advance.
Imagine a large drop from Pegasus 41 PDP → Add to Cart, or Cart → Checkout, or Checkout Step 1 → Payment.
Go deeper with behavior-level clues.
Examples:
- High PDP dwell time with low add-to-cart often means missing sizing clarity or unclear product details (e.g., users spend 60 seconds on the Pegasus PDP but still don’t add it to cart).
- Repeated filter usage suggests users can’t find the right variant (e.g., applying the size filter twice for Pegasus 41).
- Coupon retries indicates pricing hesitation or invalid promo logic (e.g., entering the same coupon 3 times).
- Address-edit loops could imply delivery uncertainty or poor autofill accuracy (e.g., users keep changing the pincode during checkout).
- Payment retries indicate slow processing or unsupported methods (e.g., PayPal keeps failing for mobile shoppers).
Segment-specific drop-offs are even more revealing:
- Mobile-first users abandoning at payment implies their preferred payment method isn’t available (e.g., PayPal not supported on the final step).
- Tier 2/Tier 3 shoppers exiting at delivery options shows long delivery timelines, or missing cash on delivery (COD).
- High-AOV customers pausing at checkout means they want clearer return or warranty reassurance.
- Price-sensitive shoppers exiting after add-to-cart implies the final price doesn’t match expectations once shipping or taxes appear.
Add signals from channel-triggered exits:
If users open an email or push notification but don’t return to complete a step, check whether the landing page matches the message or whether slow load times create an early bounce (e.g., push notification opens a PDP that loads too slowly on mobile).
At this point, your friction map should show:
- Where users exit (e.g., Pegasus 41 delivery step)
- Which segments are most affected (e.g., Tier 1 mobile shoppers)
- Which behaviors signal hesitation (e.g., repeated size-filter usage)
- Which fixes will deliver the biggest lift (e.g., adding a “Find Your Size” guide on the Pegasus PDP)
This will give you a clear list of conversion blockers that you can now prioritize and resolve across the journey.
5. Use journey analytics tools to validate patterns
Once you’ve identified where users stall, validate these findings using a journey analytics platform. This turns your initial observations into confirmed insights so you can implement the right measures with confidence.
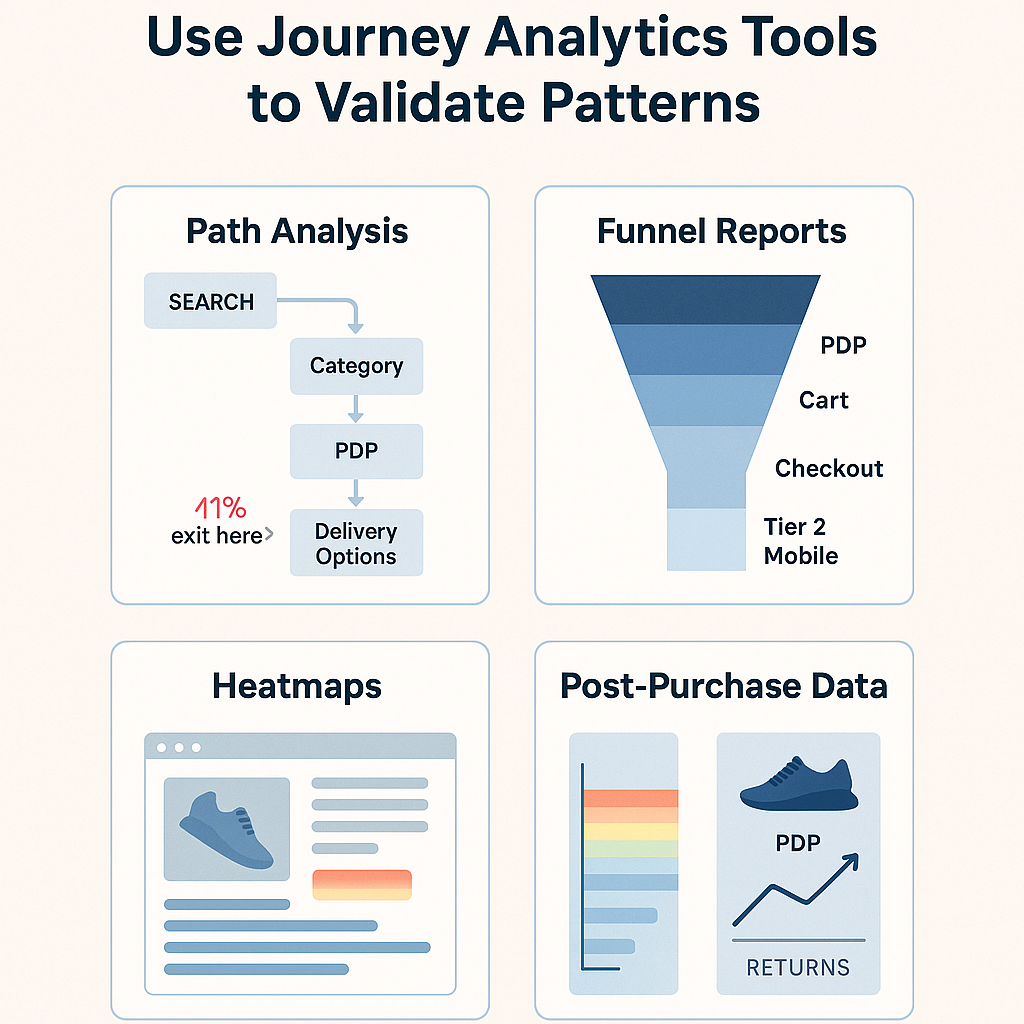
- Start with path analysis inside a journey analytics tool like Insider One: Look out for the most common user paths and highlights exactly where drop-offs spike. For example, If 41% of your “running-shoe browsers” exit after viewing delivery options, path analysis will show that pattern instantly.
- Then, use funnel reports to quantify the problem. Track how many users move from Pegasus 41 PDP → Cart → Checkout → Payment → Confirmation, segmented by device, city tier, or acquisition source. Example: You may discover that conversion drops sharply for Tier 2 mobile users at the payment step.
- Check cohort performance to see how behavior changes over time. Example: If you launched a new PDP layout, cohorts can show whether add-to-cart improved for runners but not for lifestyle sneakers.
- Use heatmaps and session replays (Hotjar, FullStory) to understand micro-frictions. Example: You might see users scrolling past the size guide or missing the delivery timeline entirely.
- Finally, cross-check with post-purchase data: Example: If many returns come from the Pegasus 41 PDP due to sizing issues, that confirms the “size uncertainty” friction discovered earlier.
By combining behavioral patterns with tool-backed evidence, you get a data-verified picture of how your journey performs and which improvements will deliver real conversion lift.
6. Prioritize fixes based on impact and effort
Once you’ve validated where friction exists, rank the improvements using a simple impact-versus-effort lens. This ensures you focus on the fixes that lift revenue fastest instead of spreading effort across low-value work.
Start with high-impact, low-effort fixes
These improvements require minimal engineering and immediately move users forward.
Examples:
- Add a clear size or fit guide on PDPs with high dwell time but low add-to-cart (e.g., Pegasus 41 shoppers repeatedly using size filters but not converting).
- Surface delivery timelines earlier for regions with high exit rates on the delivery-options step (e.g., Tier 2 shoppers dropping because timelines were shown too late).
- Enable preferred mobile payment methods (e.g., PayPal for mobile-first users who abandon at payment).
- Replace slow-loading images or scripts that delay checkout (e.g., checkout taking 4–5 seconds to load on 4G connections).
These provide the fastest measurable lift and should be completed first.
Then address high-impact, medium-effort fixes
These may take development time but influence entire segments.
Examples:
- Simplify checkout steps for users who repeatedly retry payment.
- Personalize PDP content for category-loyal segments (e.g., running-shoe browsers seeing “Your likely size” or recommended variants).
- Trigger automated reminders for users who revisit the same PDP multiple times without adding to cart.
Avoid low-impact work early, like cosmetic layout tweaks, minor copy changes, or micro-testing that doesn’t influence stage progression.
7. Activate improvements across channels
Once your fixes are prioritized, roll them out across every channel that shapes the customer journey.
The goal is to make sure the website, app, email, push, SMS, and WhatsApp all push users in the same direction instead of working separately.
Start with on-site and in-app changes
Update the experience where users are actively deciding what to buy.
Examples:
- Add clearer size or fit guidance to the Pegasus 41 PDP.
- Surface delivery timelines earlier for Tier 2 shoppers.
- Streamline checkout steps for users who repeatedly retry payment.
- Adjust CTAs based on intent (e.g., “Find Your Size” for filter-heavy users).
These changes influence behavior in the moment, when users are most ready to act.
Move to lifecycle channels
Use your ESP, push platform, or Insider One’s journey builder to automate nudges that reinforce the fixes you made onsite.
Examples:
- Send size-fit assistance to users who stalled on PDPs after using size filters multiple times.
- Send a payment-specific reminder if someone exited at payment (e.g., “PayPal now available — complete your order”).
- Send delivery reassurance to regions with high drop-off at shipping options (e.g., “3–4 day delivery to your pincode”).
Each message should match the exact friction point identified for that user.
Integrate real-time triggers
Trigger messages or prompts based on what the user does right now.
Examples:
- If a high-intent user revisits the Pegasus PDP twice in 24 hours → show a size guide pop-up.
- If payment fails → send a one-click recovery link via email or push.
- If a user opens a cart reminder but doesn’t checkout → follow up with a push notification instead of another email.
These dynamic reactions reduce friction before a user gets frustrated.
Complete the loop with post-purchase channels
Your fixes should also show up after the purchase, so users notice the improvements.
Examples:
- Update delivery notifications to reflect clearer timelines.
- Adjust support templates for size issues if sizing was a major friction point.
- Reinforce trust (e.g., easy returns messaging) if hesitation was high among premium buyers.
This will improve retention and reduce support load.
8. Measure performance and iterate continuously
Once your improvements are live, measure how each change affects user progression. This helps you see which fixes are actually lifting conversion, which segments are responding, and where further refinement is needed.
Start by tracking stage-level progression rates.
Measure how many users move through each key step:
- Pegasus 41 PDP → Add to Cart
- Cart → Checkout
- Checkout → Payment
Break this down by segment, device, geography, and acquisition source so you know exactly where gains come from.
Example: Tier 1 mobile users may show a 12 percent lift in PDP → Add to Cart after the sizing guide update.
Monitor micro-behaviors that signal improvement.
These small changes are early proof that friction is decreasing even before major conversion shifts.
Examples:
- Lower PDP dwell time for Pegasus 41 (indicating sizing confusion is reduced).
- Fewer coupon retries at checkout (pricing friction reduced).
- Reduced address-edit loops (delivery clarity improved).
- Higher usage of preferred payment methods (PayPal adoption after enabling it).
- Faster returns from cart reminders (nudges are now more effective).
Use journey analytics platforms like Insider One to track how fixes affect specific paths.
- If users now move smoothly through the delivery-options step → timeline visibility fix worked.
- If mobile drop-off remains high at payment → the issue needs deeper investigation.
Review cohort performance weekly or monthly.
Compare users who shopped after fixes vs. those who shopped before.
Example:
After adding the Pegasus size guide, new cohorts may show:
- Higher add-to-cart rates
- Lower return rates
- More efficient checkout flow
If the gap keeps widening over time, it means your improvements are compounding.
Finally, connect everything to revenue metrics.
Track the KPIs leadership cares about:
- Checkout completion rate
- AOV lift (e.g., more customers buying bundles after PDP personalization)
- Repeat purchase rate
- Retention curves
This confirms whether your journey enhancements are improving both immediate conversion and long-term value.
9. Build automated customer journeys to scale your improvements
Once you know which interventions create the biggest lift, turn them into automated journeys so the system applies them consistently without manual work. This lets every user receive the right nudge at the right moment.
Start by automating your highest-impact fixes
Convert your proven improvements into triggered flows inside your journey platform.
Examples:
- Trigger a size-fit prompt when a user spends more than 45 seconds on the Pegasus 41 PDP without adding to cart.
- Send a one-click recovery link when a user’s payment fails.
- Show delivery-timeline reassurance to shoppers in regions that frequently drop off during shipping selection.
- Send a targeted offer or reminder to users who return to the same product within 24 hours.
These automations reinforce the exact behaviors you want users to take.
Automate channel sequencing
Let the system choose the next best channel based on how the user responds.
Examples:
- If a user ignores an email → follow up with a push notification.
- If they open a push but don’t come back → send a WhatsApp reminder.
- If a user visited from Instagram Ads → prioritize mobile-friendly channels.
Instead of a fixed schedule, the sequence adapts to real behavior.
Add real-time decisioning
Make sure your journeys update based on what users do in the moment.
Examples:
- Adjust recommendations based on recent browsing (e.g., show Pegasus 41 Wide Fit if users filter sizes repeatedly).
- Match incentives to discount sensitivity.
- Tailor delivery messaging by region or inventory availability.
This creates journeys that feel responsive rather than preplanned.
Extend the logic into post-purchase and retention
Build automated flows that keep customers engaged long after checkout.
Examples:
- Delivery updates that reflect your earlier friction fixes.
- Reorder reminders for consumables or high-usage products.
- Cross-sell nudges based on previous browsing (e.g., matching socks or insoles for running-shoe buyers).
- Lapse-prevention flows for customers who haven’t returned in 60–90 days.
These automations improve lifetime value without requiring new campaigns each week.
Implement a solid customer journey mapping process
A strong customer journey works only when it’s treated as an operational loop that keeps feeding new insight back into the experience.
Once your mapping framework is in place (segmentation, touchpoint tracking, friction spotting, validation, fixes, activation, measurement, and automation) the final layer is discipline.
Teams that manage this loop consistently always outperform those that revisit the journey only during quarterly reviews or major redesigns.
Platforms like Insider One make this easier to sustain.
You can see paths, funnels, hesitation patterns, and missed progression moments as they unfold.
That level of visibility can turn the journey into something you can actively guide rather than diagnose after the fact.

Keep Reading
4 min.
Chris Baldwin
3 Feb 2026
9 min
Muharrem
23 Dec 2025
10 min.
Muharrem
11 Oct 2024